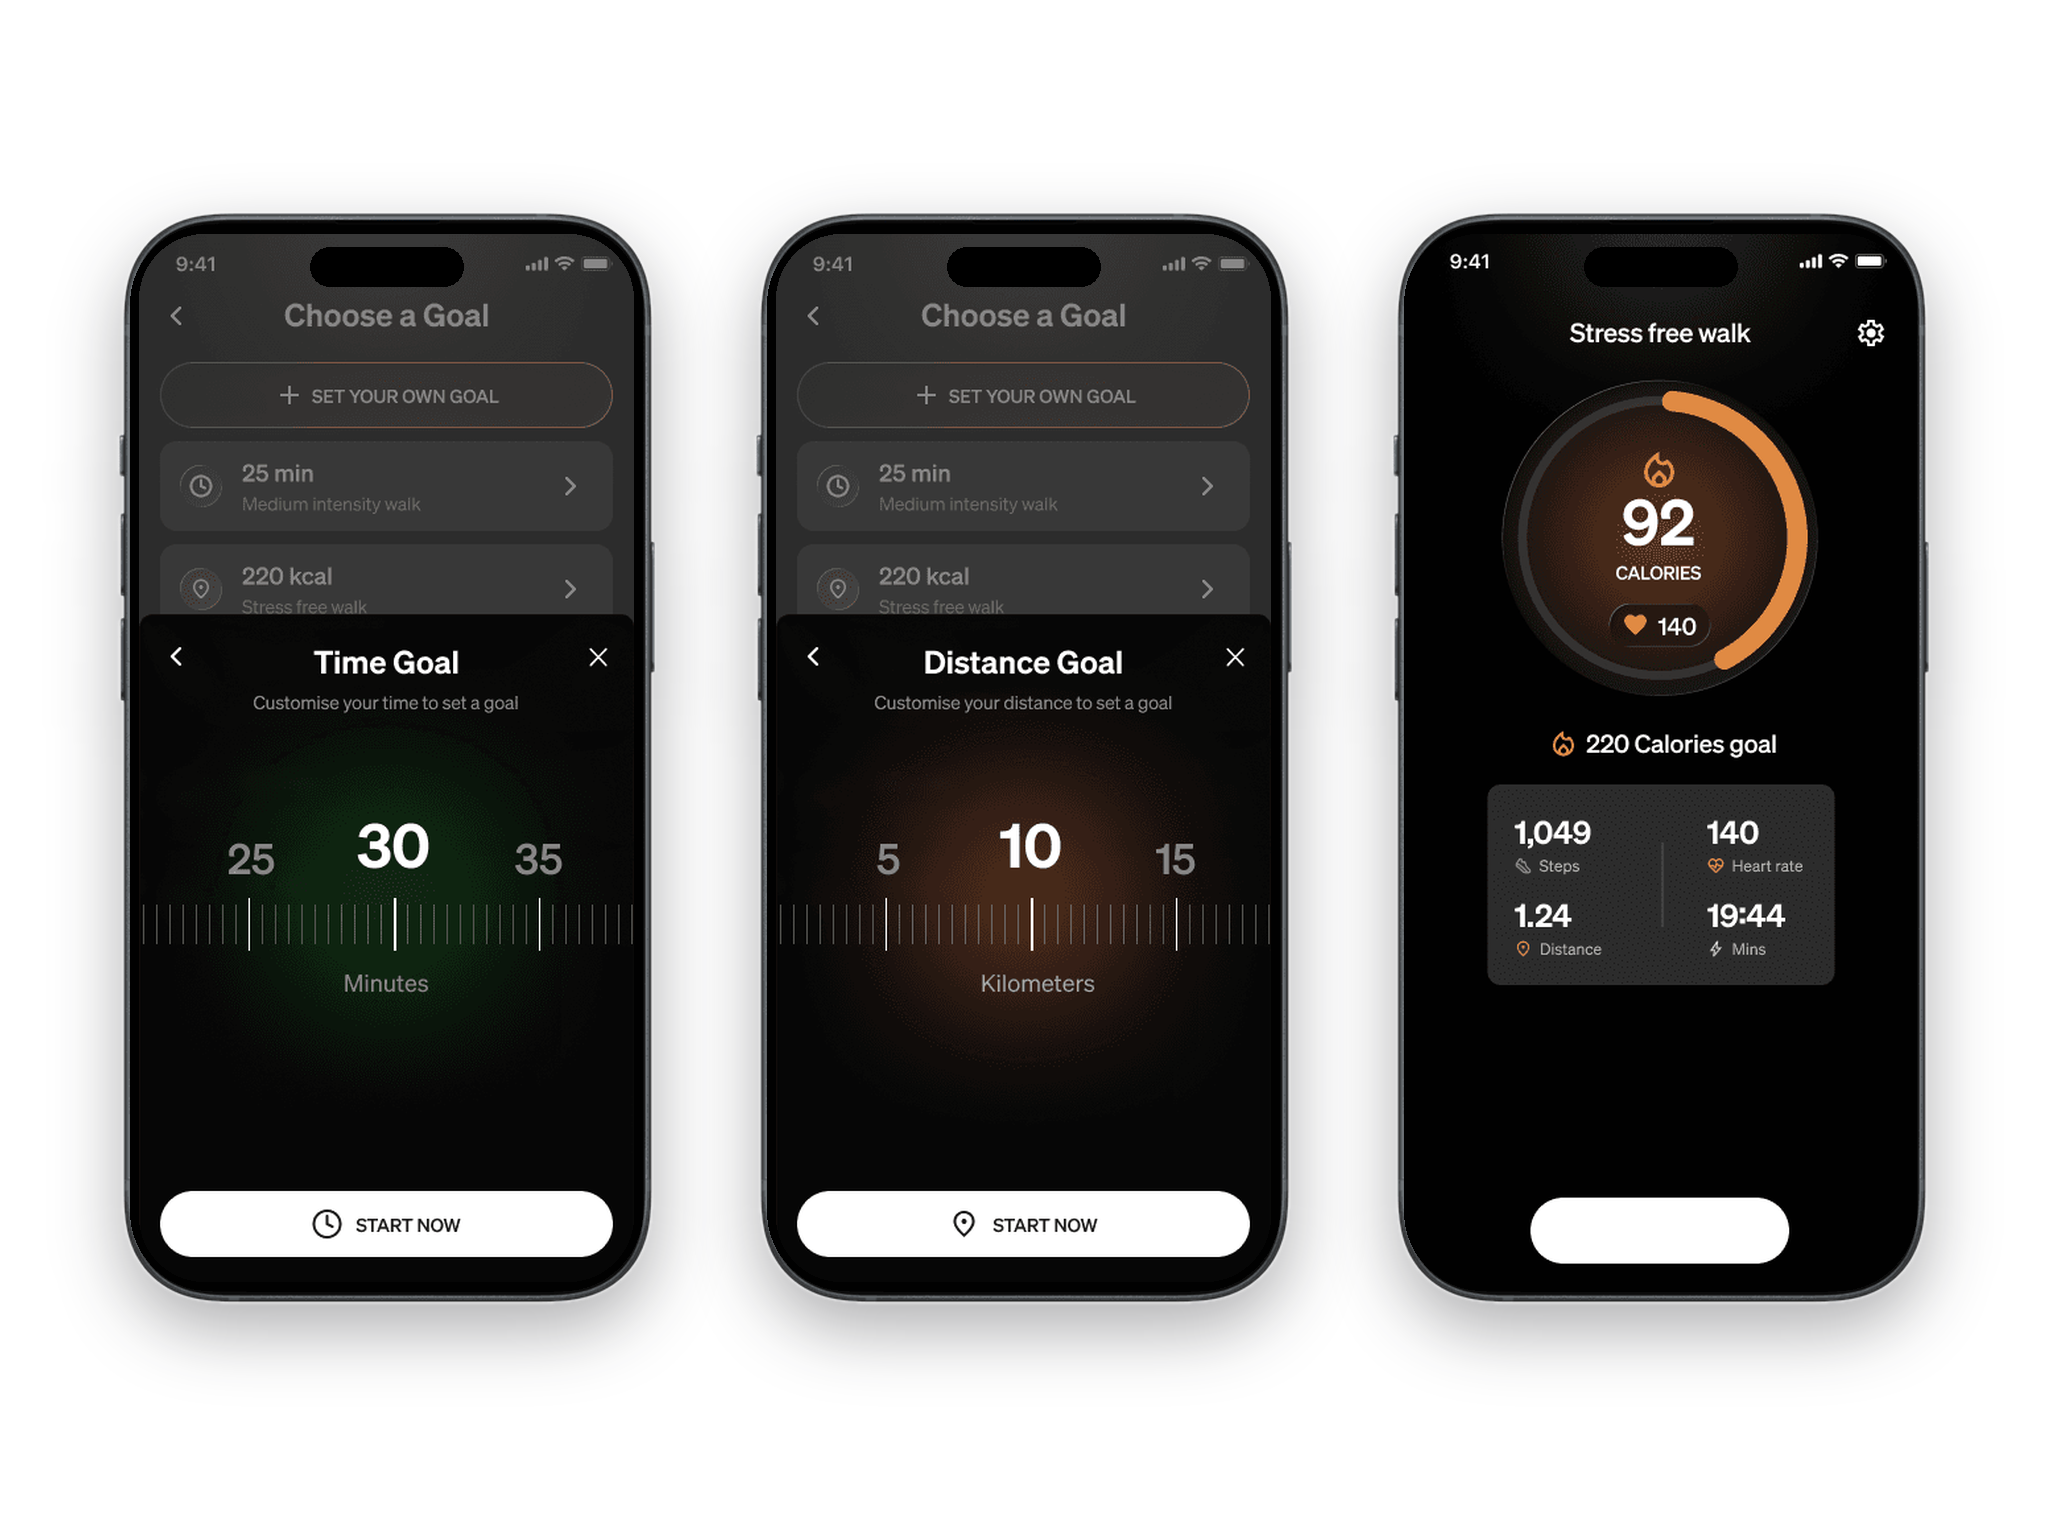
Sportstech Live 2026
Workout history redesign
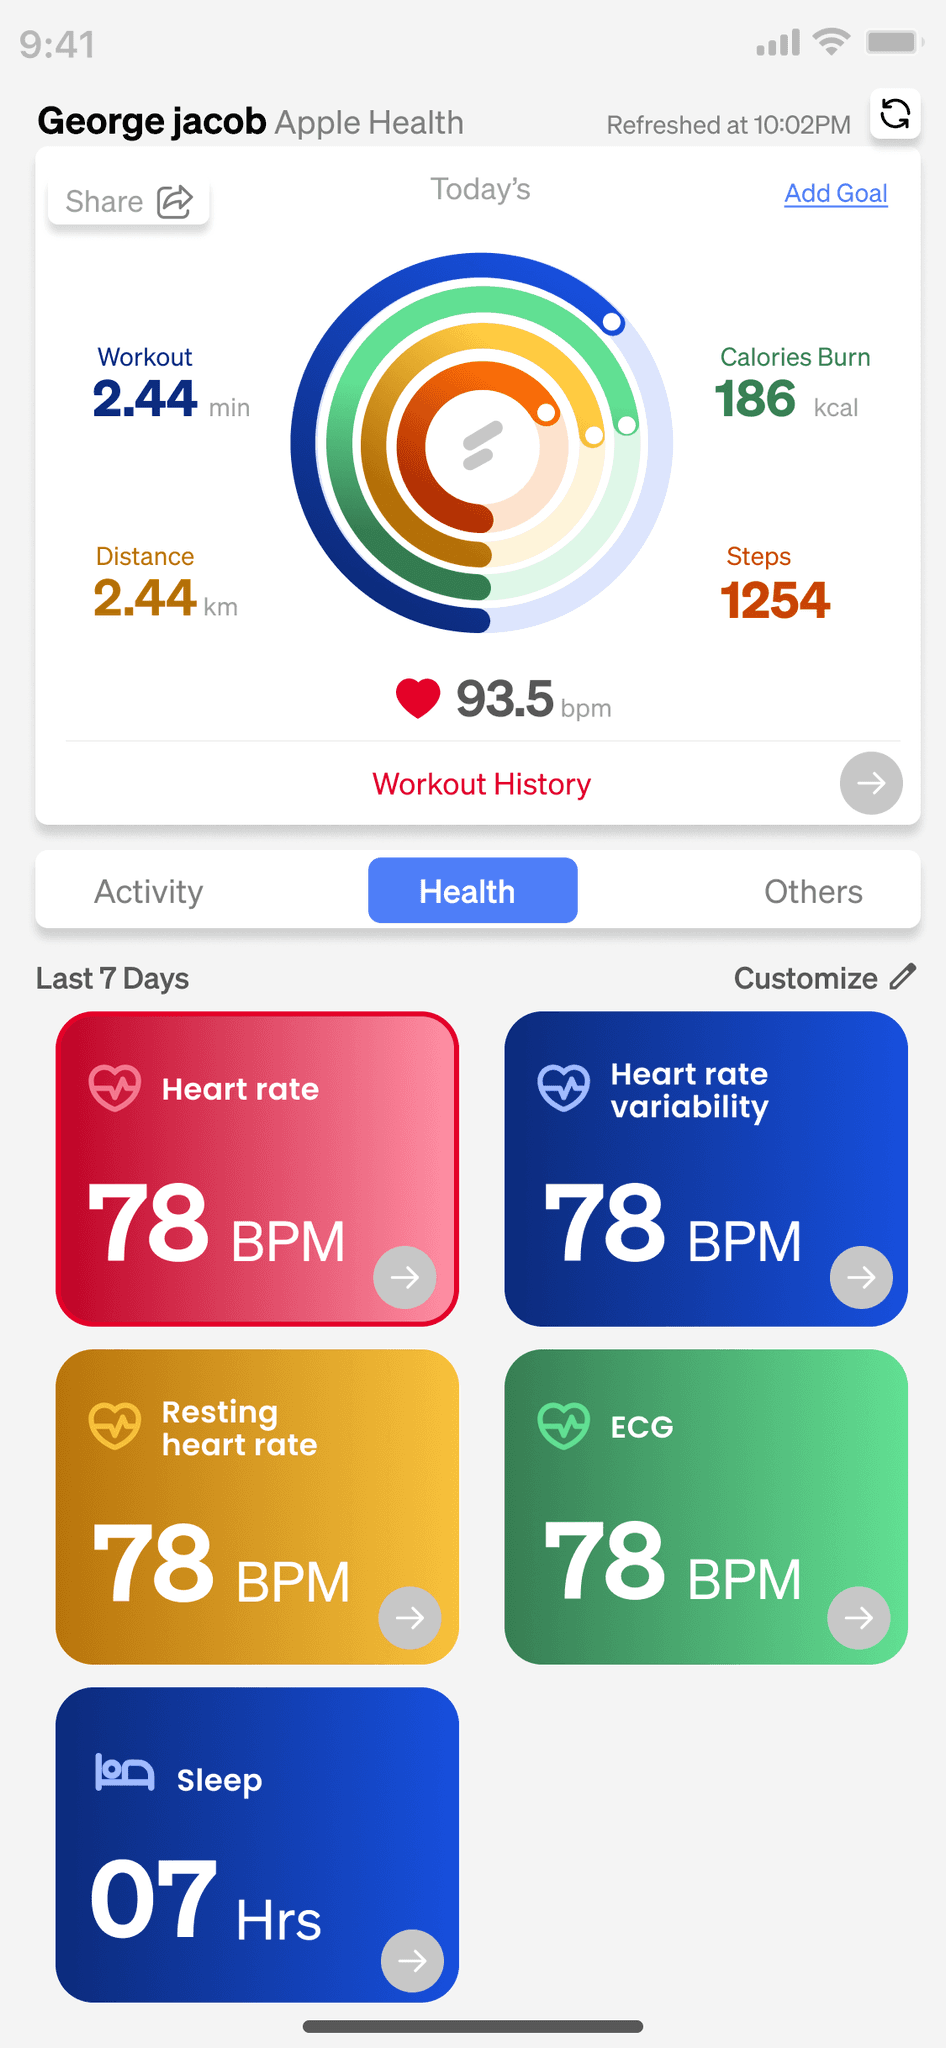
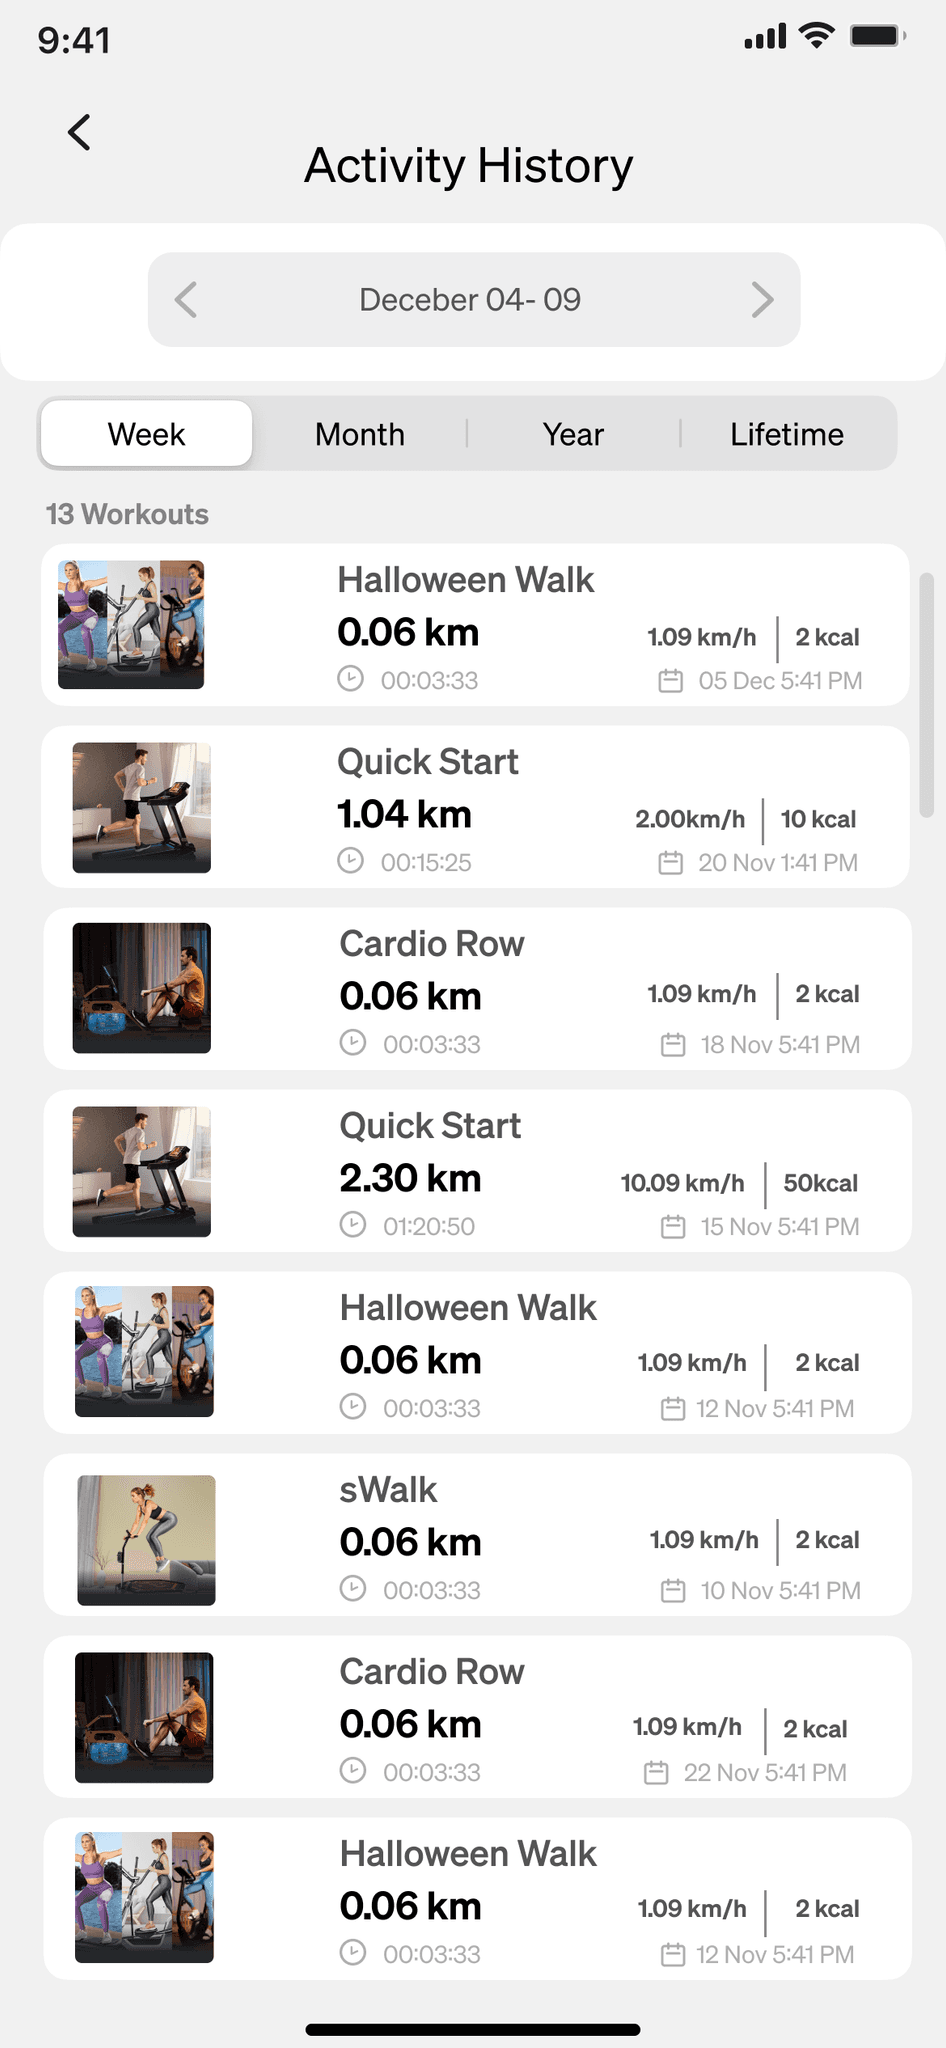
The Workout History experience was redesigned to make activity data and past workouts easier to understand, explore, and revisit. The new experience brings performance metrics, health data, and workout history into a more structured system, giving users a clearer view of their progress over time.
The redesign focused on simplifying information architecture, improving data hierarchy, and making historical activity more actionable while keeping the experience visually consistent with the STL app.
- Role
- Product Designer
- Timeline
- May 2026
- Team
- 1 Designer
- Platform
- Mobile application
Problem
When data becomes difficult to navigate
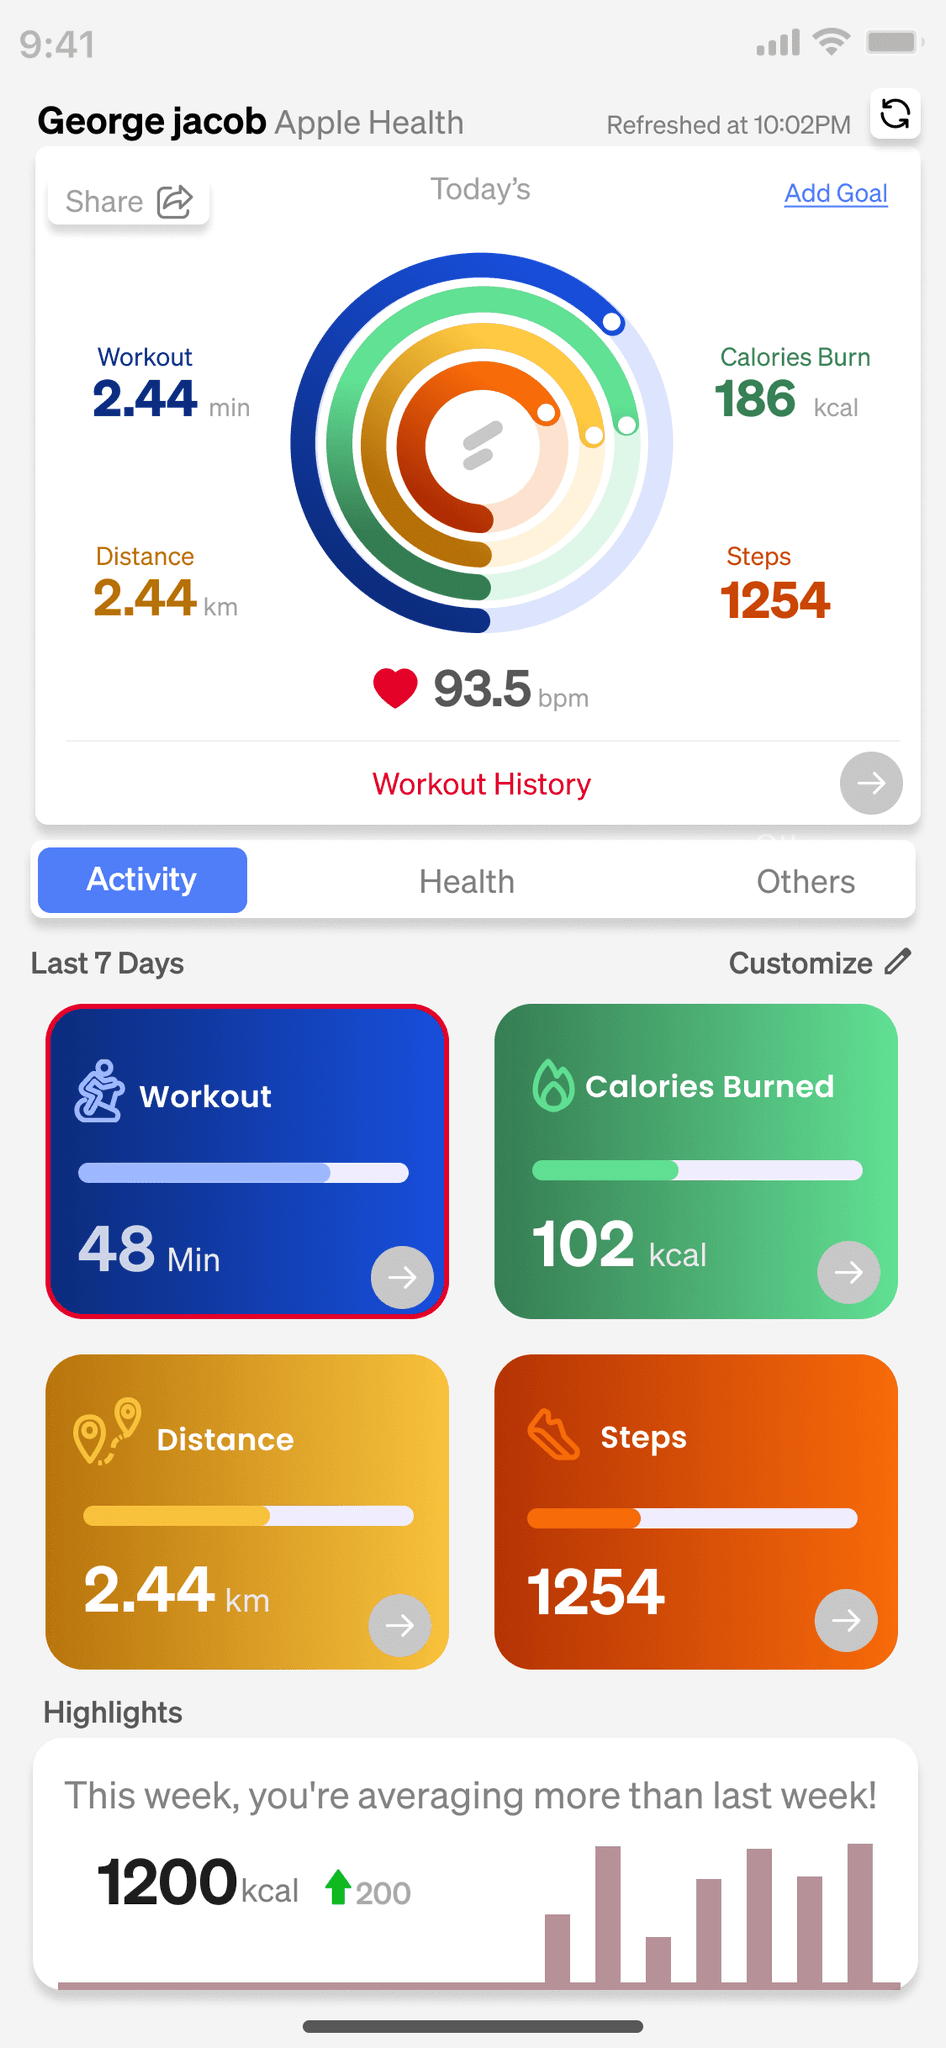
The previous Workout History experience contained valuable data, but it was difficult to scan and understand.
- Fragmented informationActivity metrics and workout history were separated across different views and interactions.
- Too many layers of navigationUsers had to move between tabs, sub-tabs, and metric-specific screens to find relevant information.
- Weak information hierarchyImportant metrics such as calories, workout duration, distance, and steps didn’t have a clear visual priority.
- Limited historical contextIndividual metrics were presented mostly in isolation, making it harder to understand progress and activity patterns.
- Workout history lacked focusCompleted workouts were presented as a basic list without enough emphasis on the overall activity journey.
- Inconsistent experienceDifferent metric views used different layouts and interactions, creating a less cohesive experience.
Designs
The design
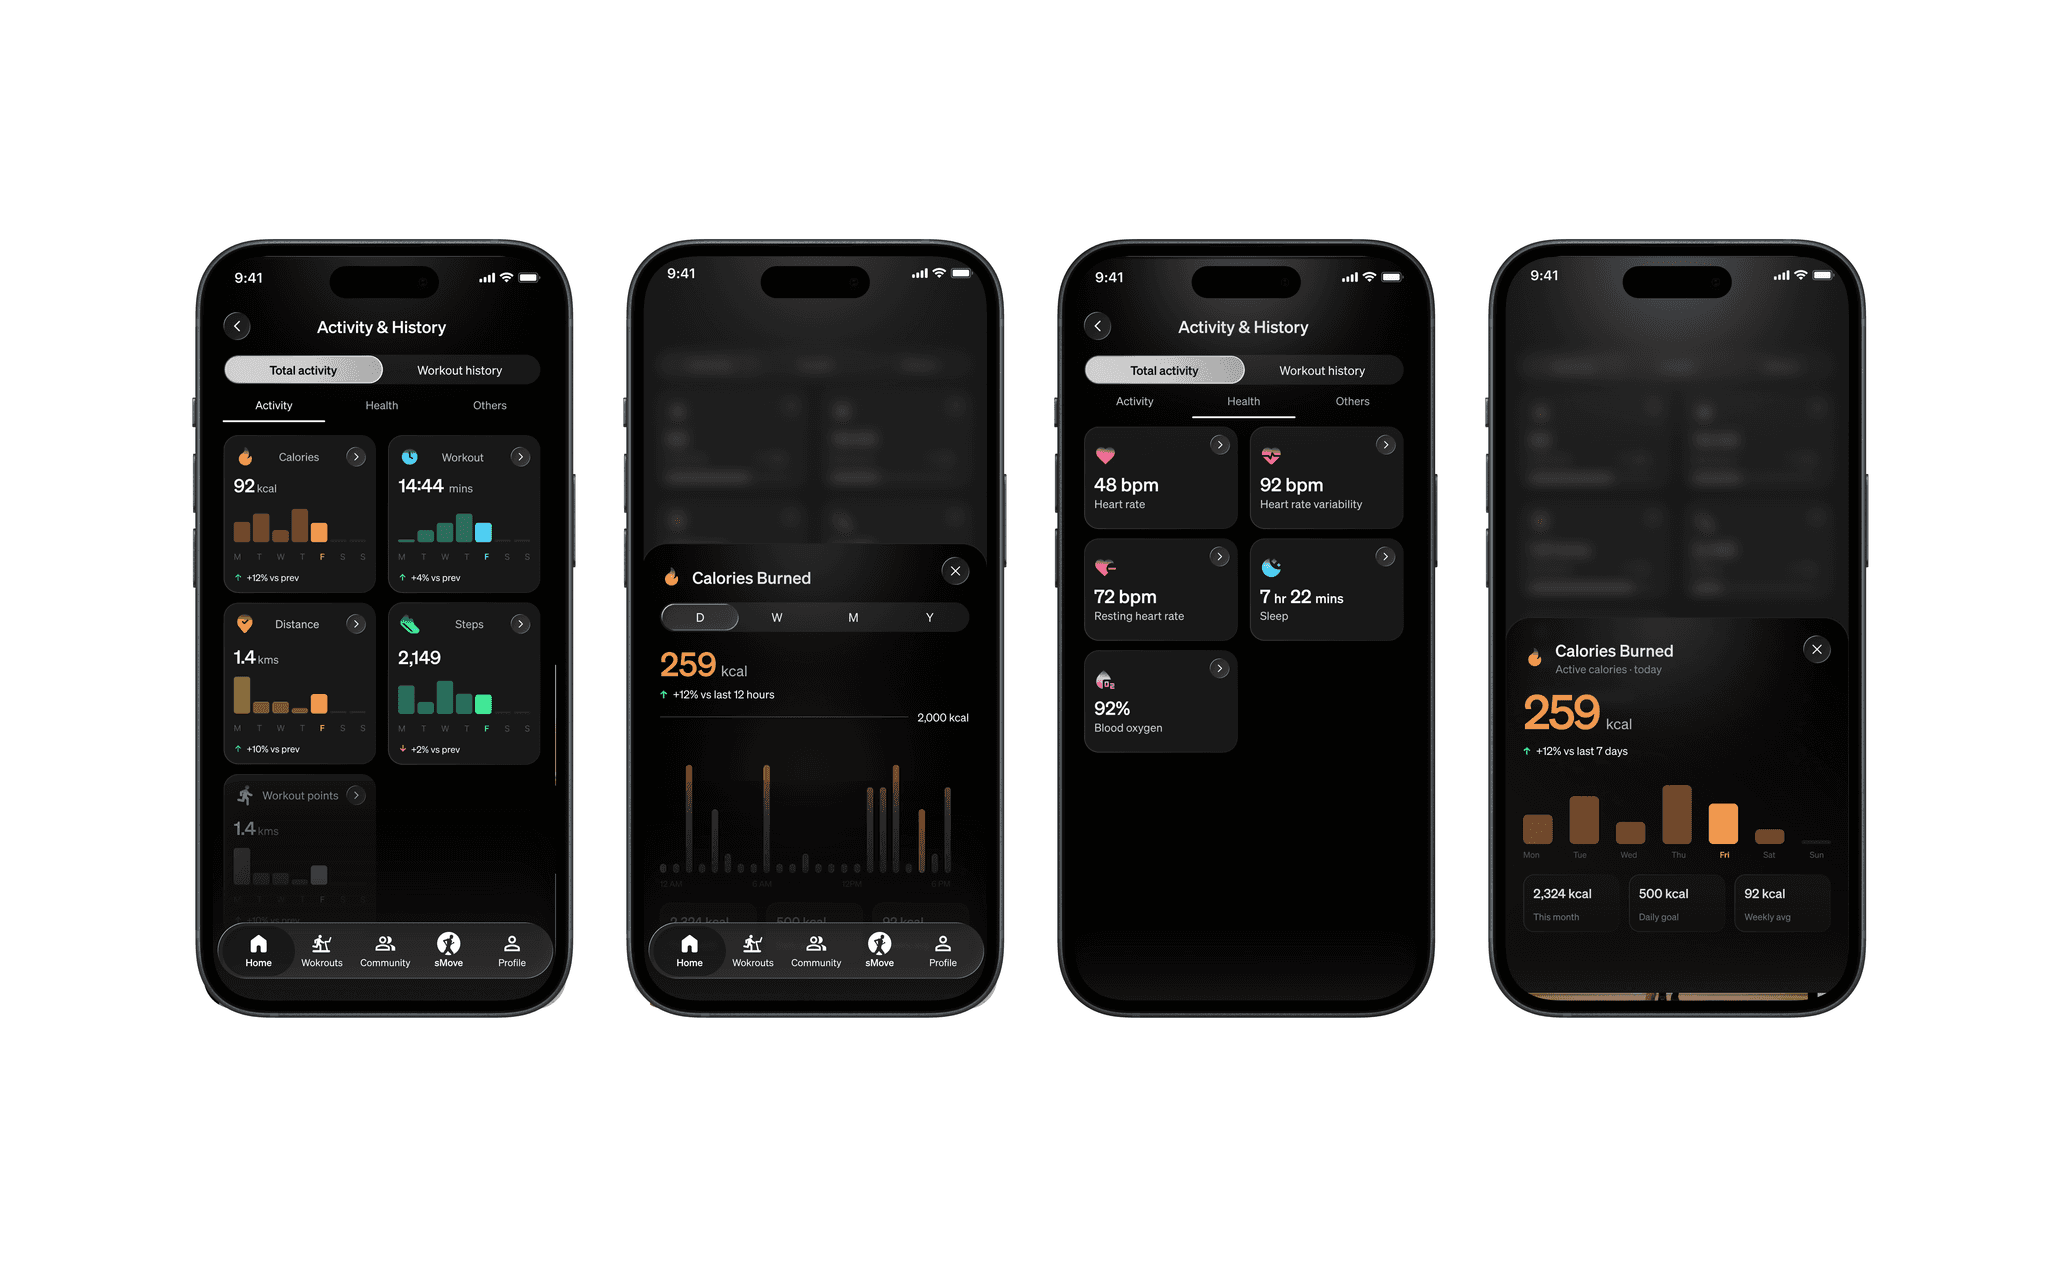
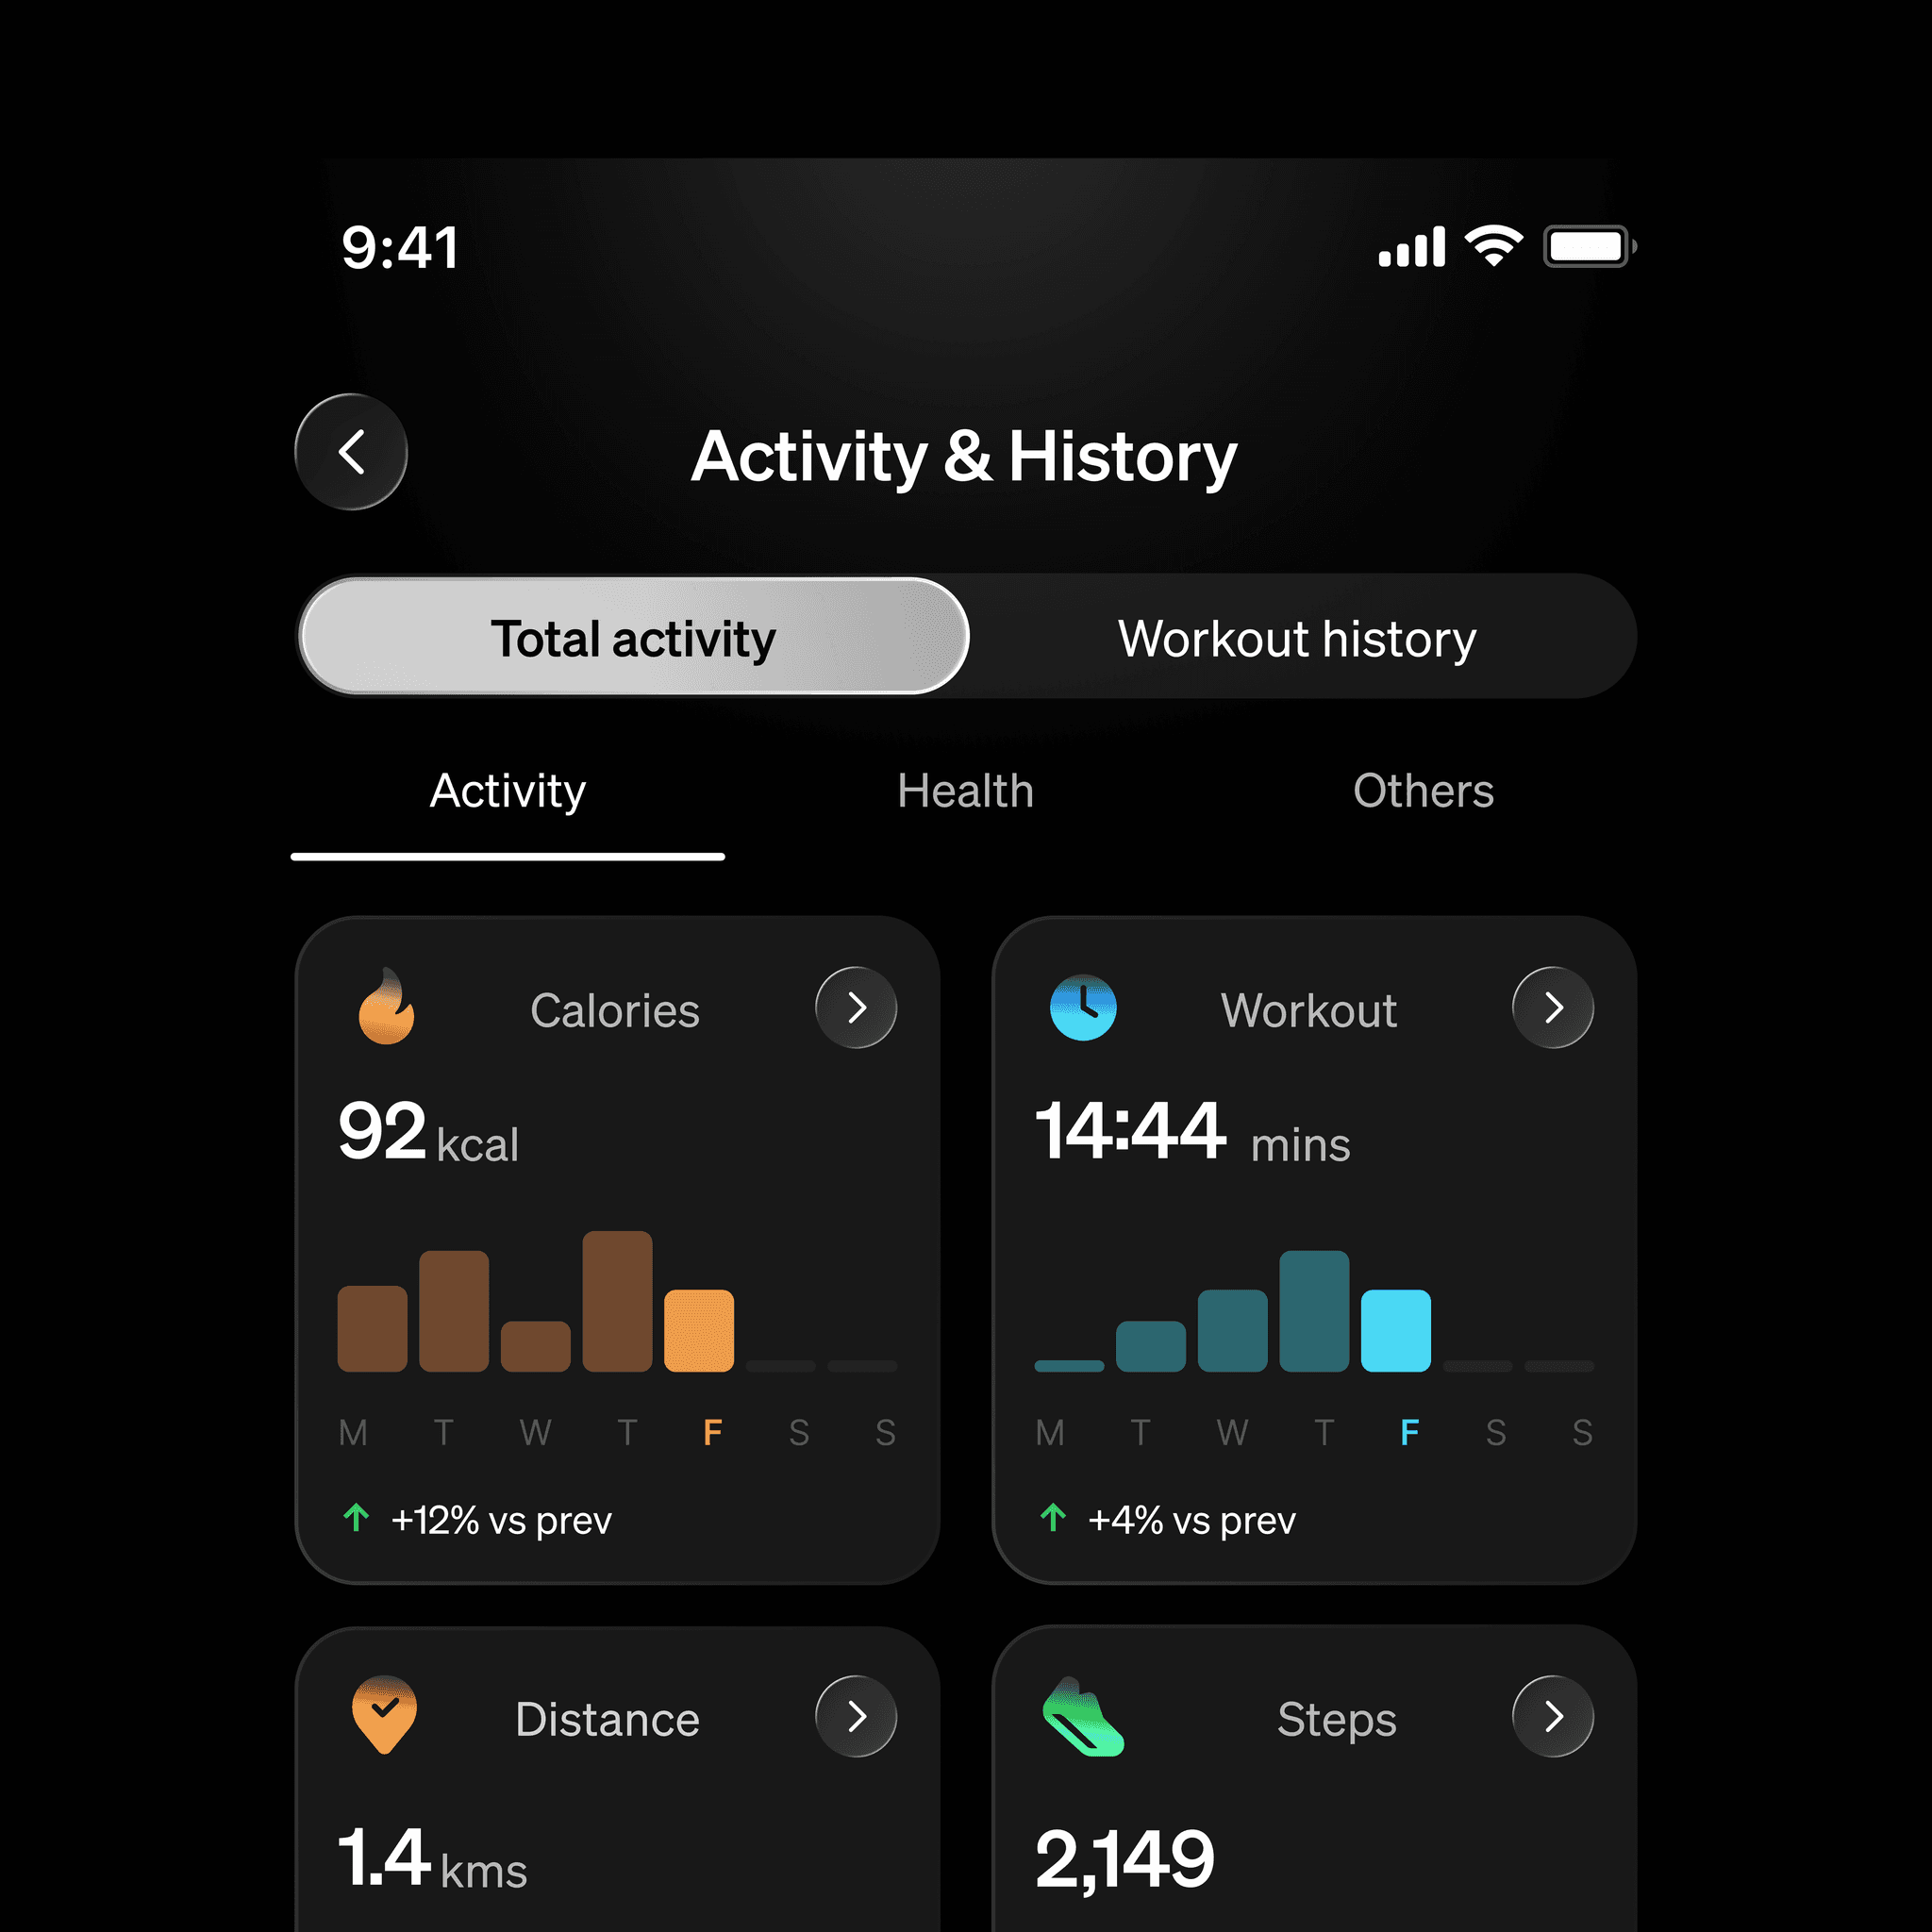
I restructured the experience around three core areas: Activity, Health, and Other metrics, alongside a dedicated Workout History view.
1. Unified activity overview
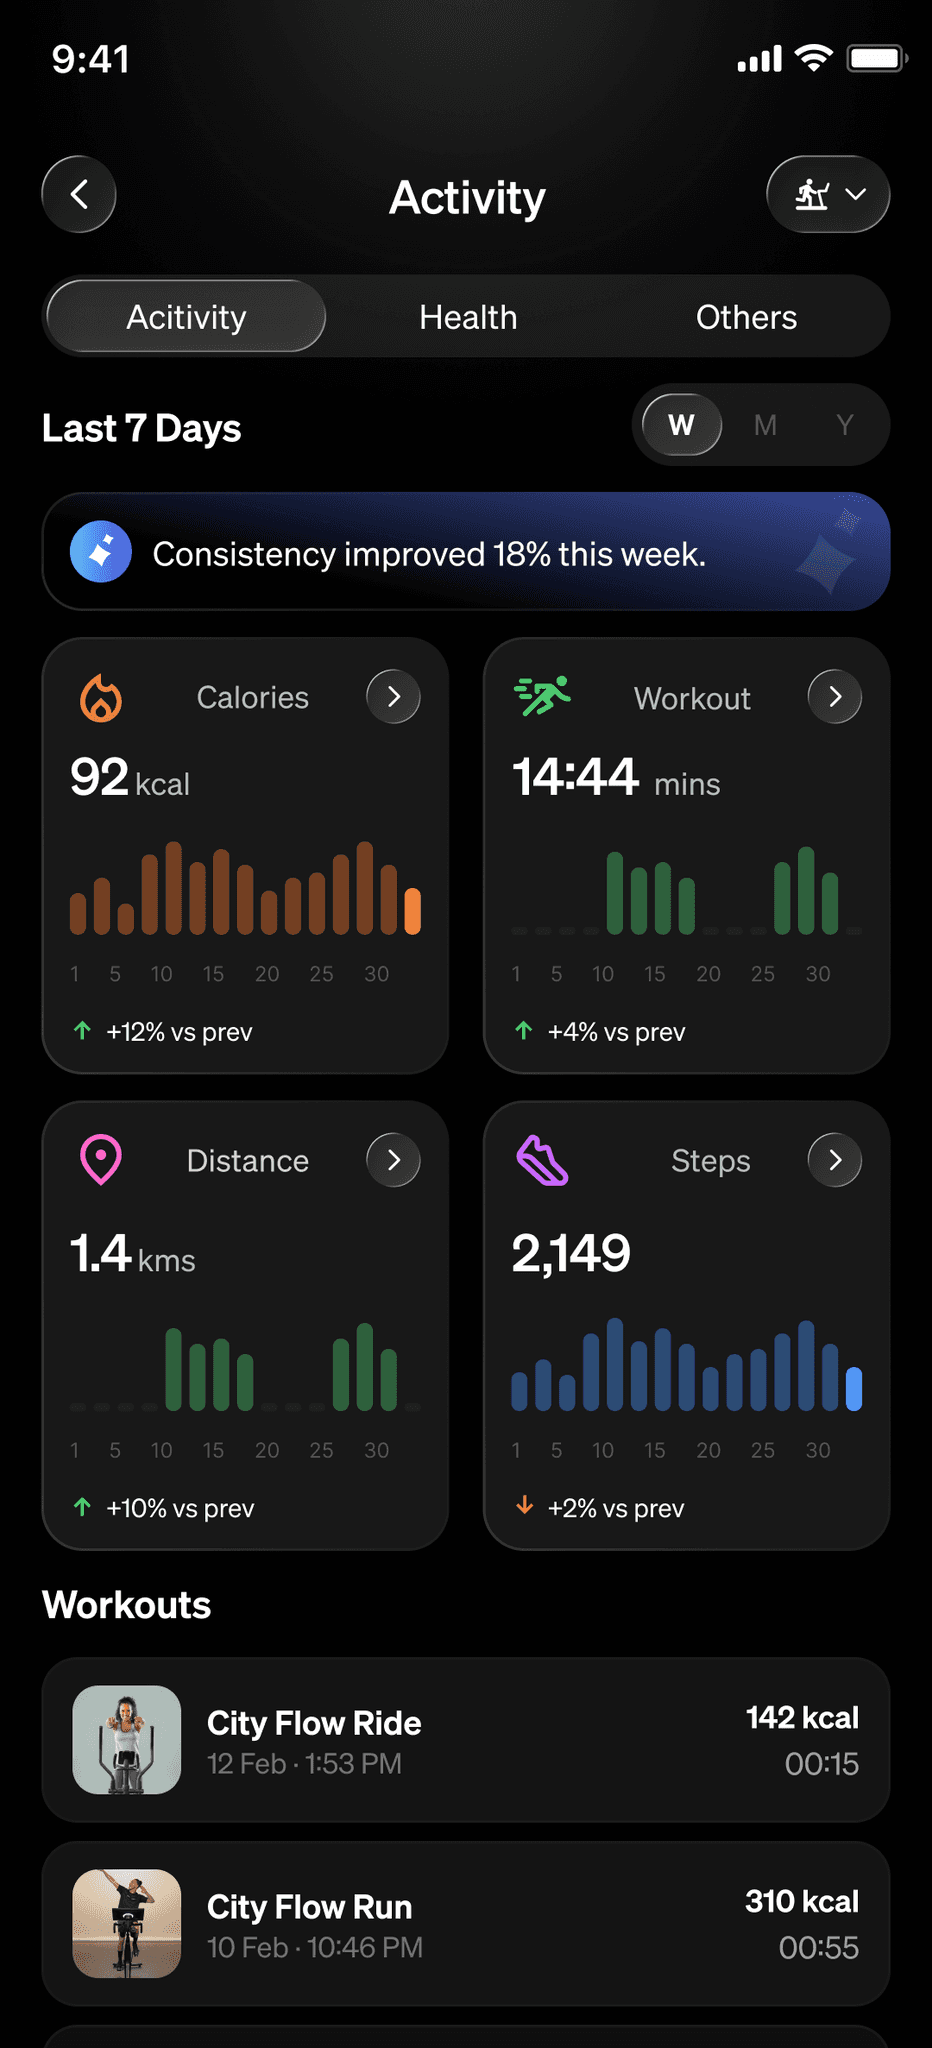
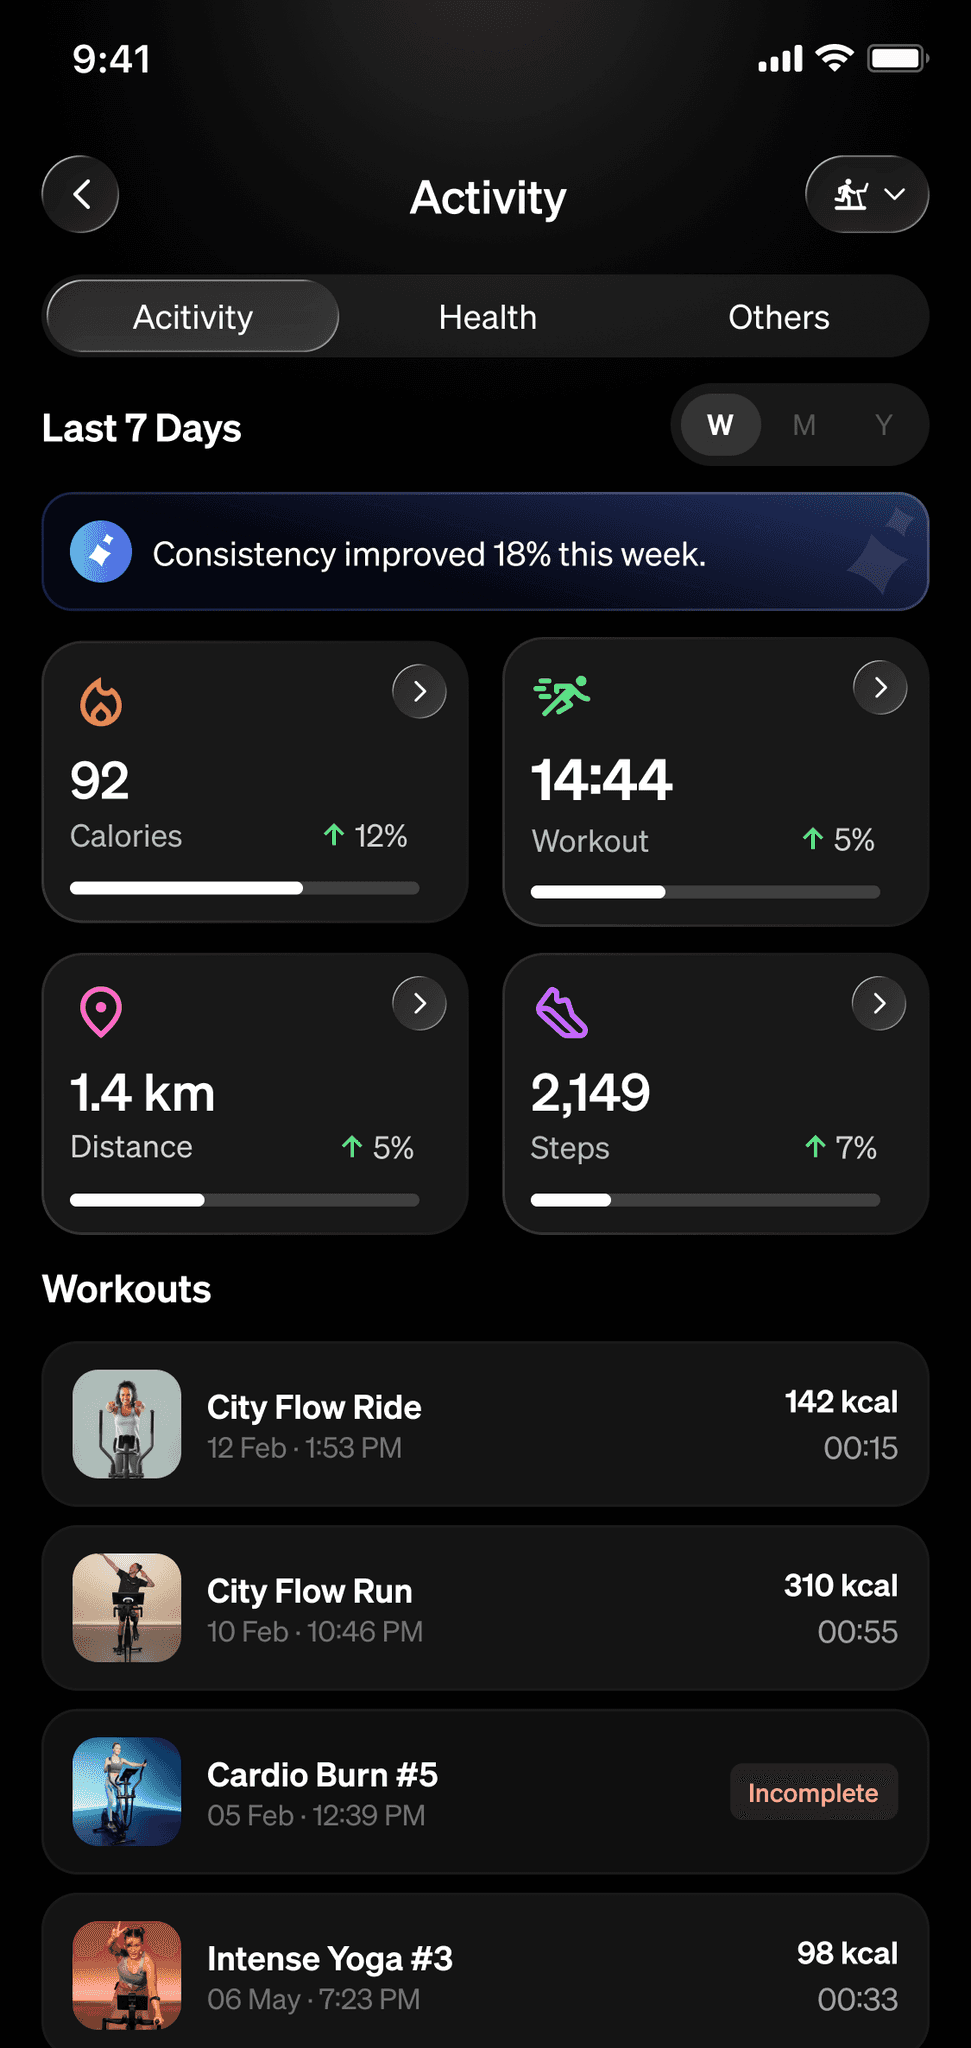
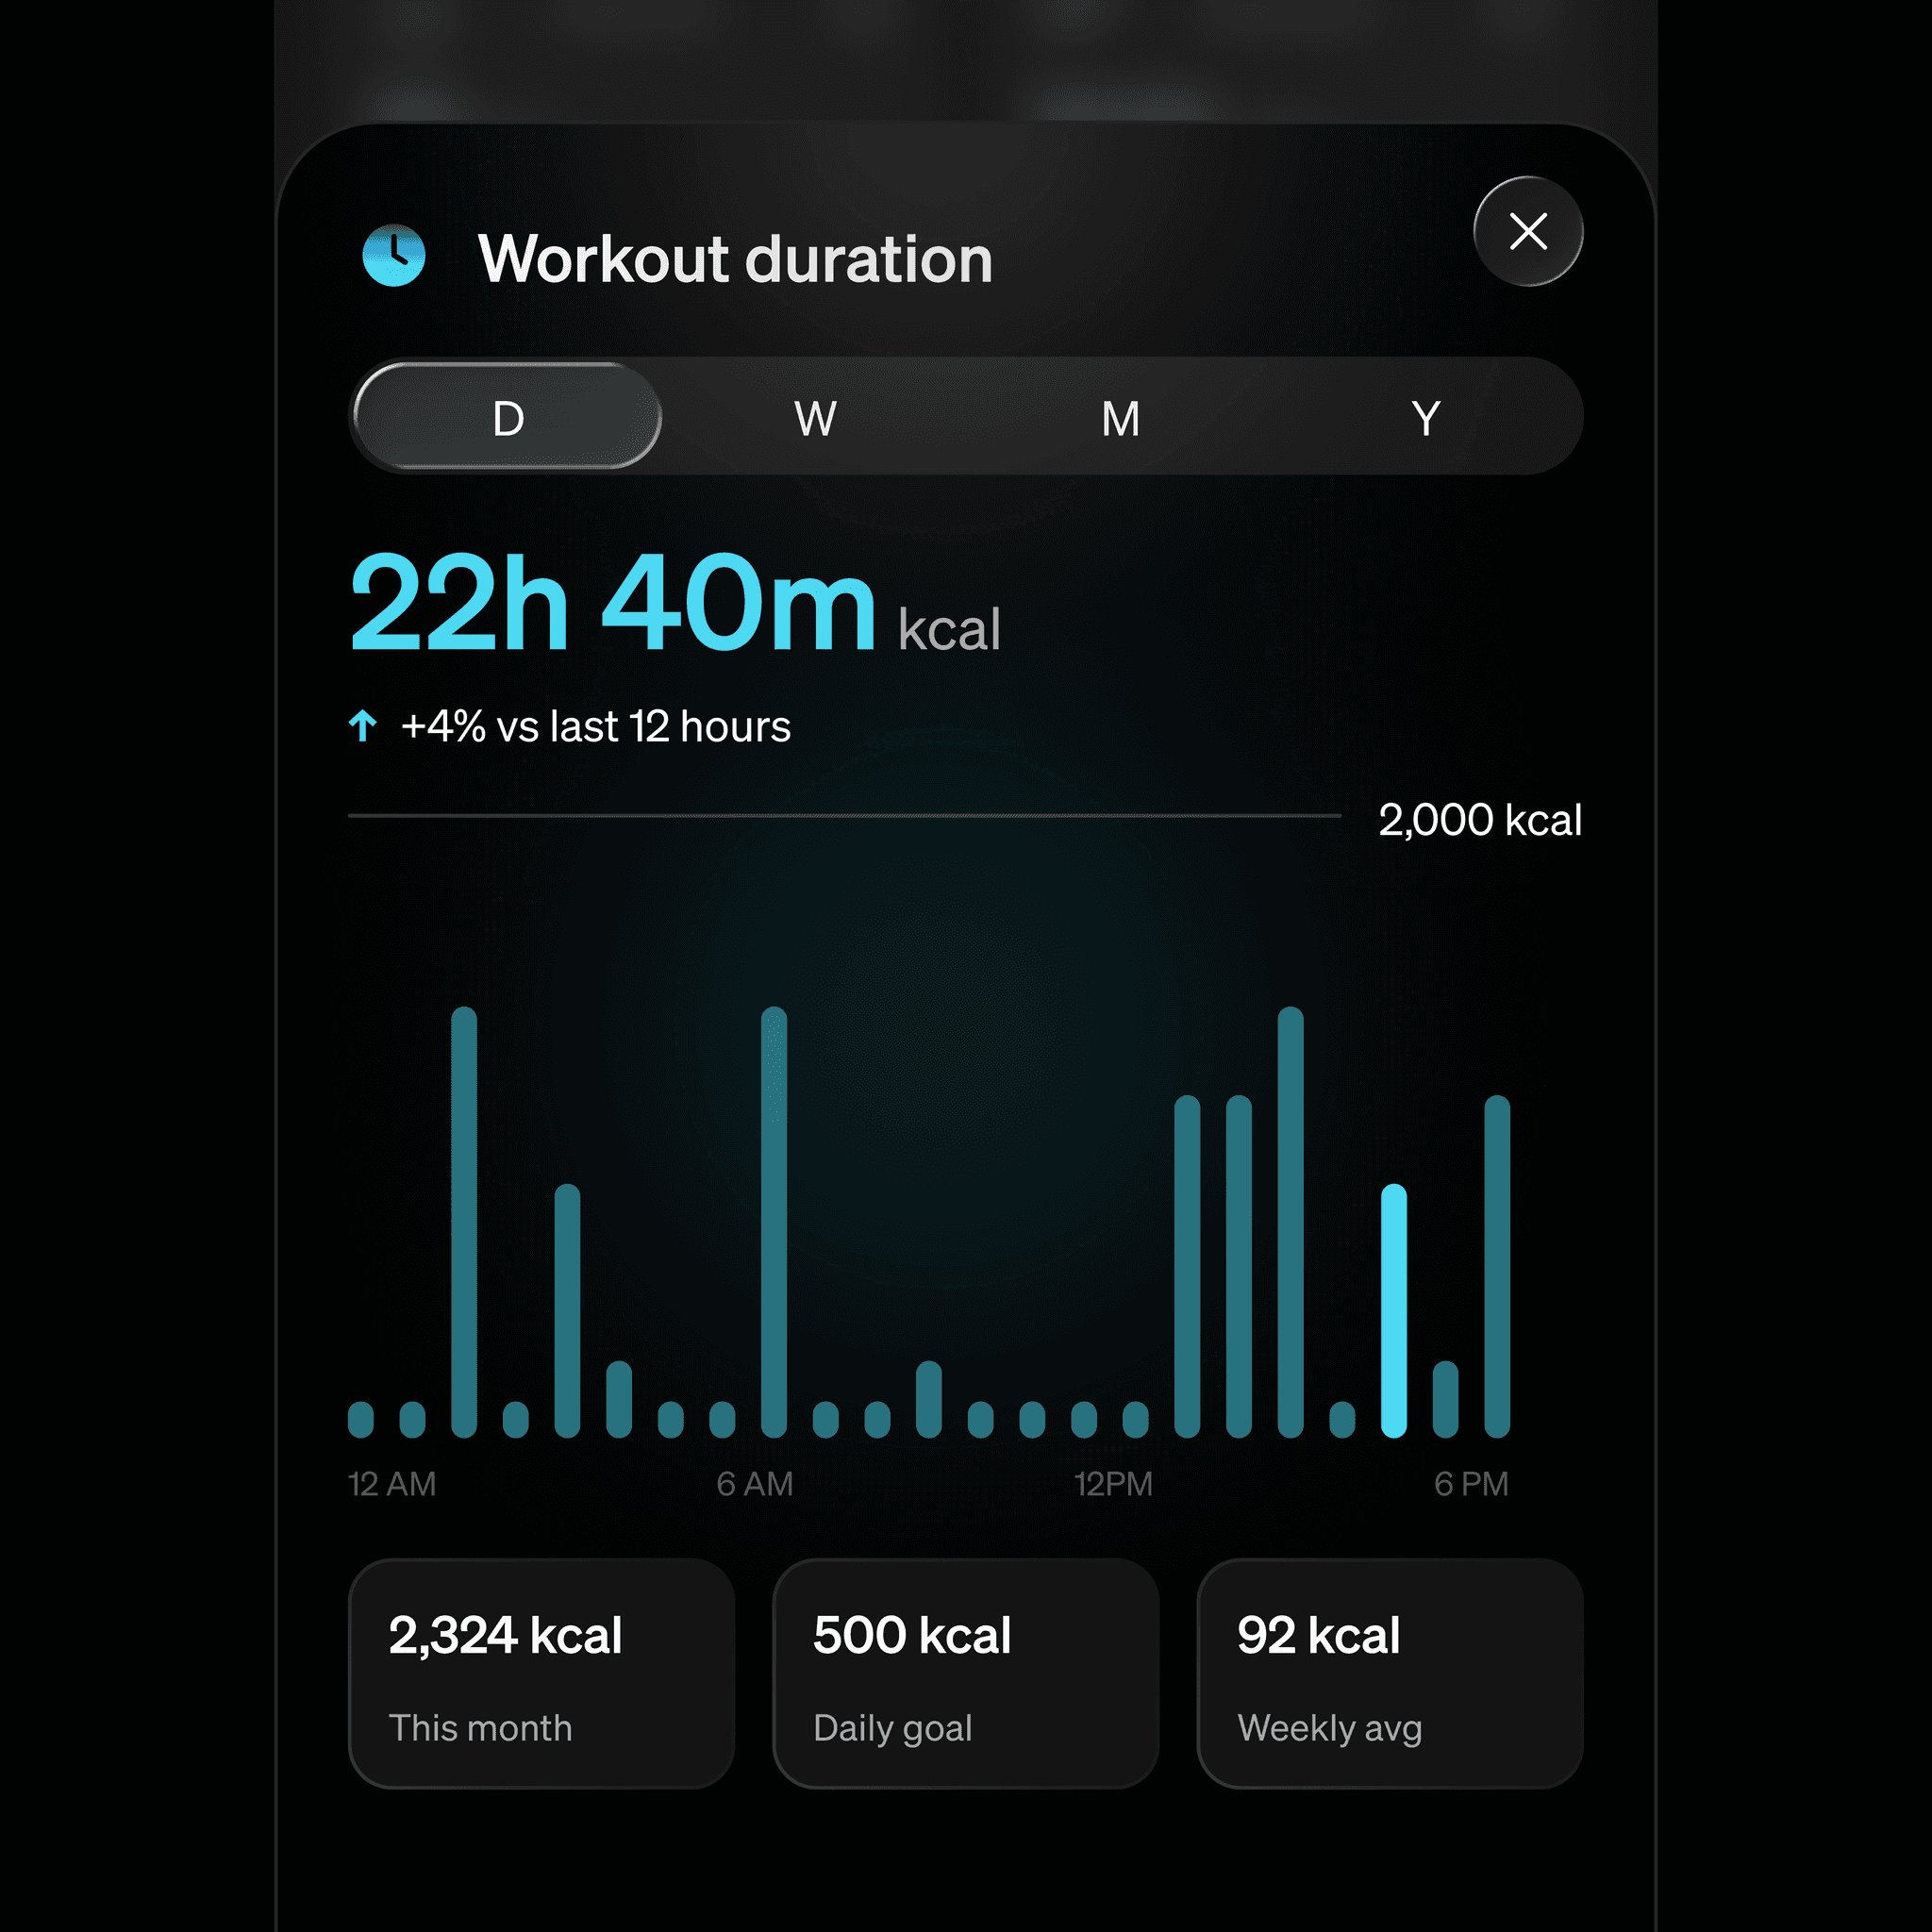
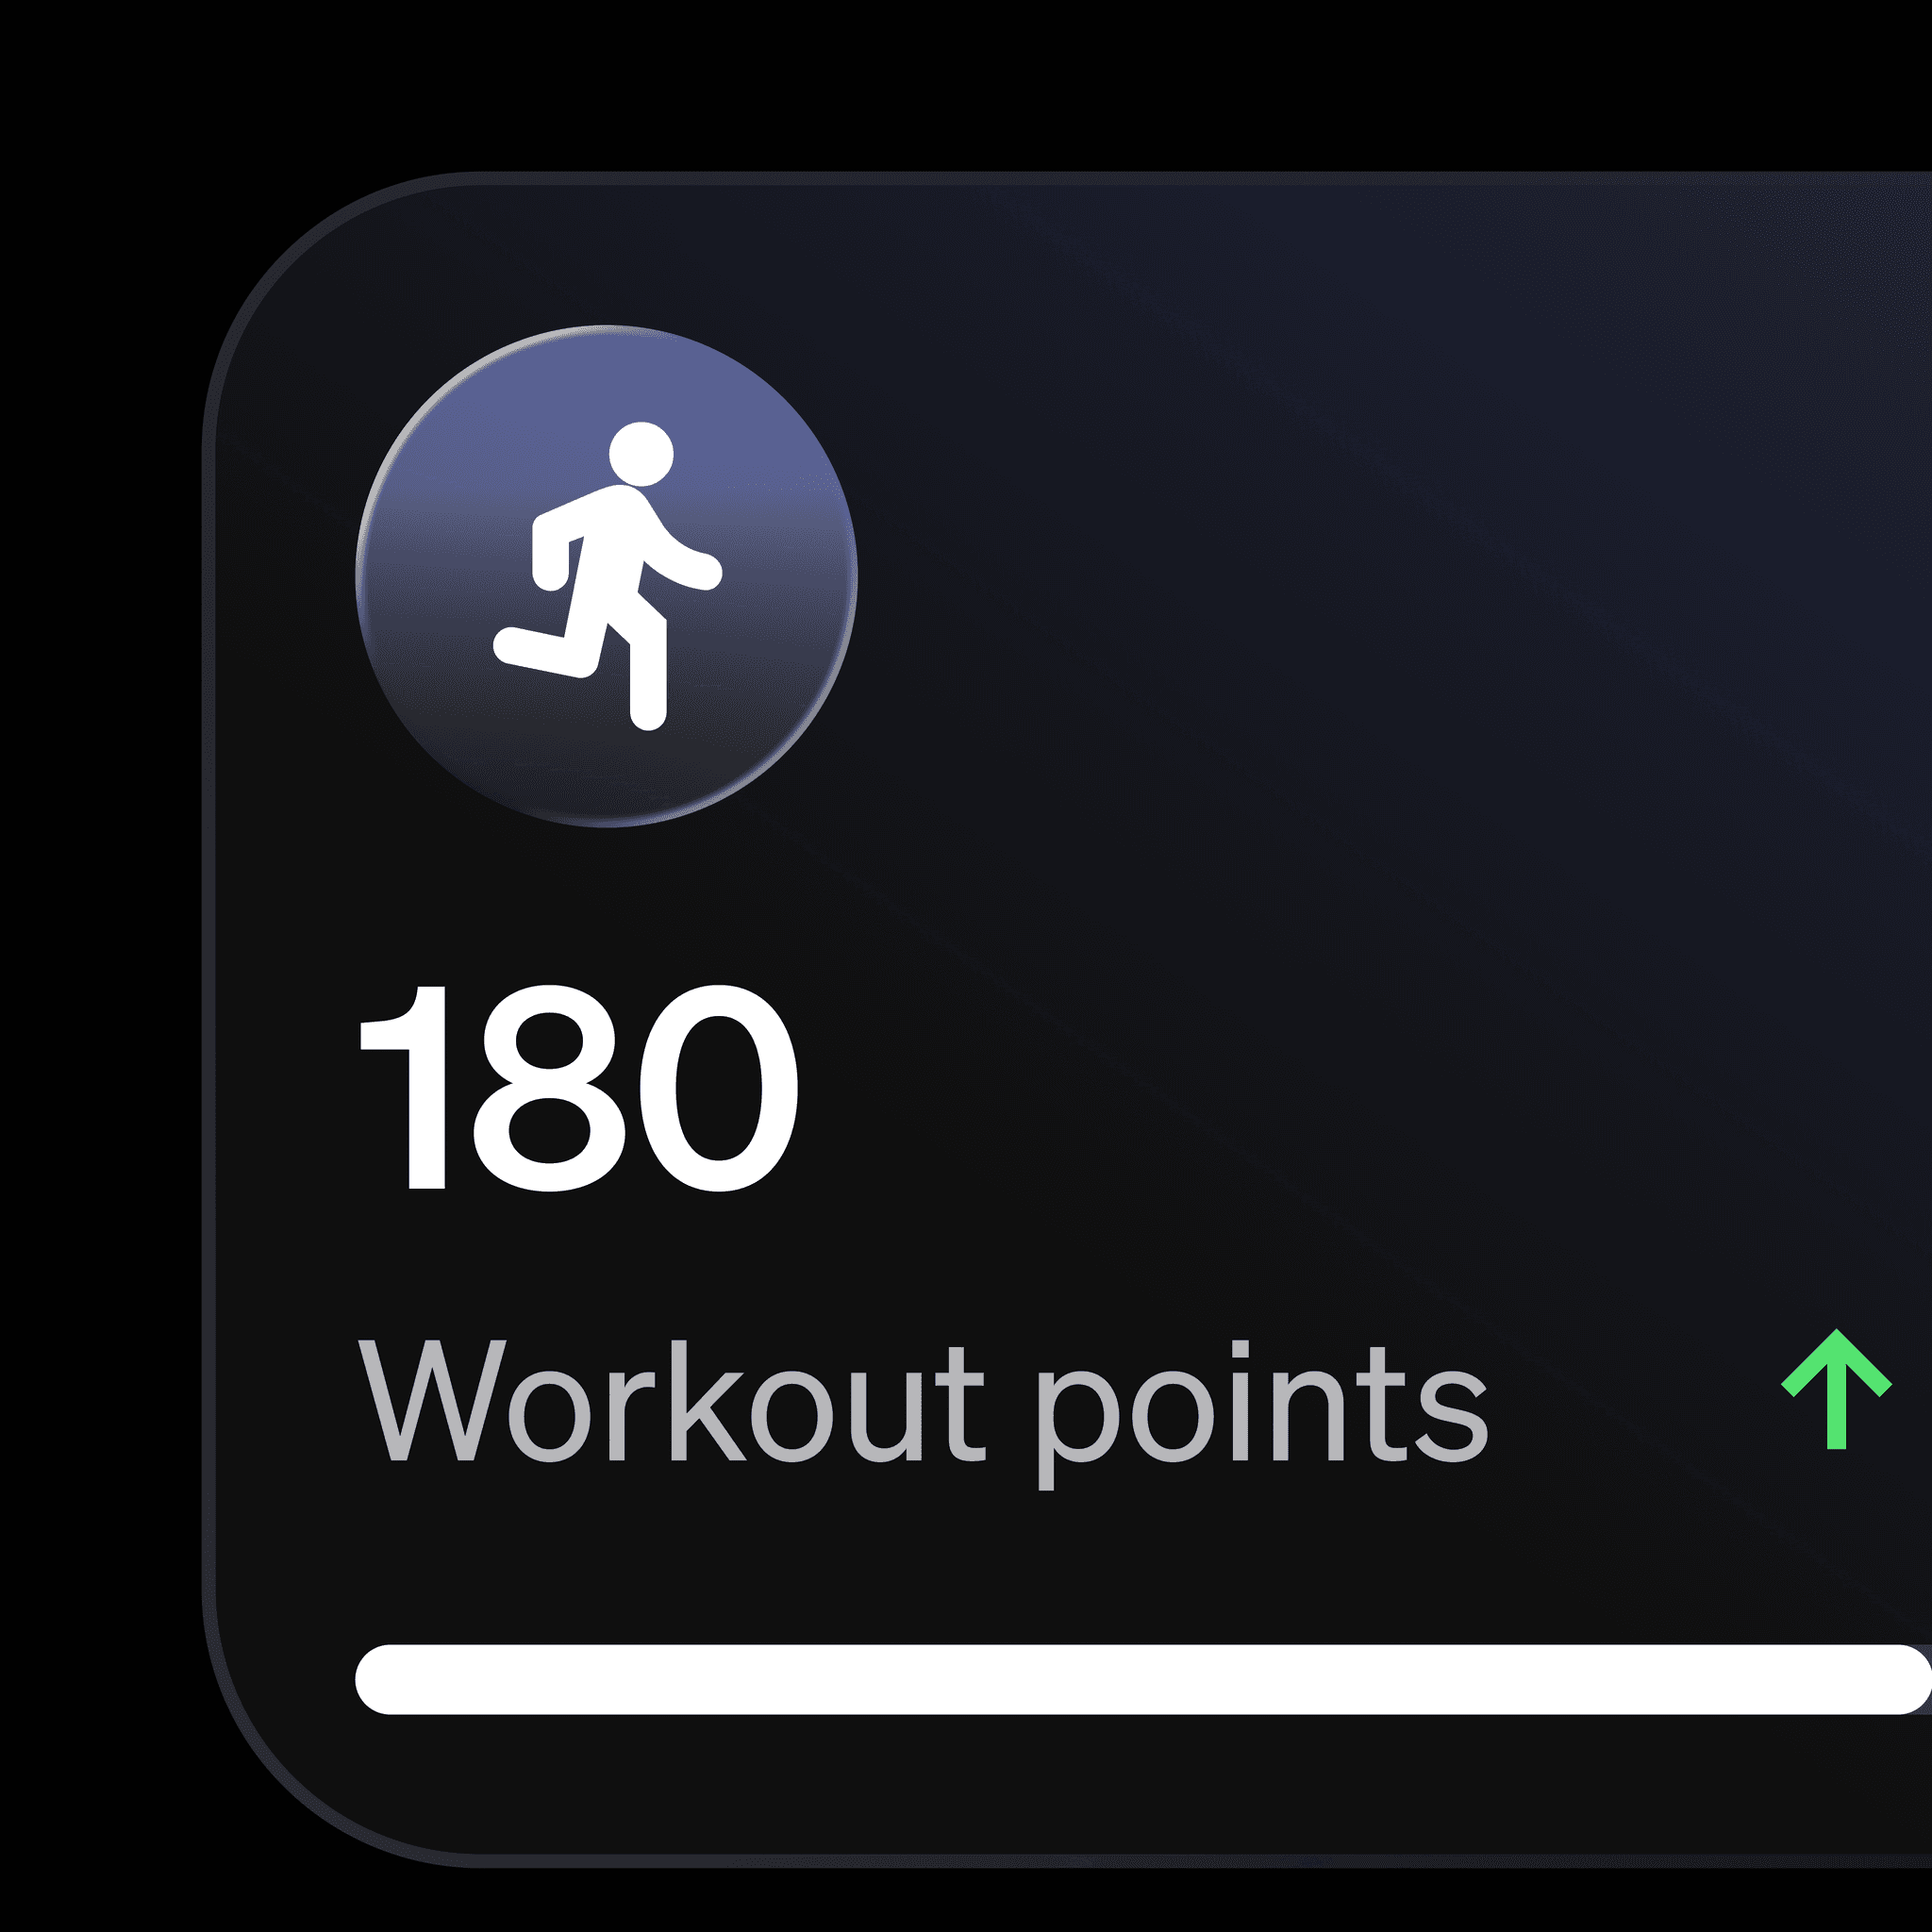
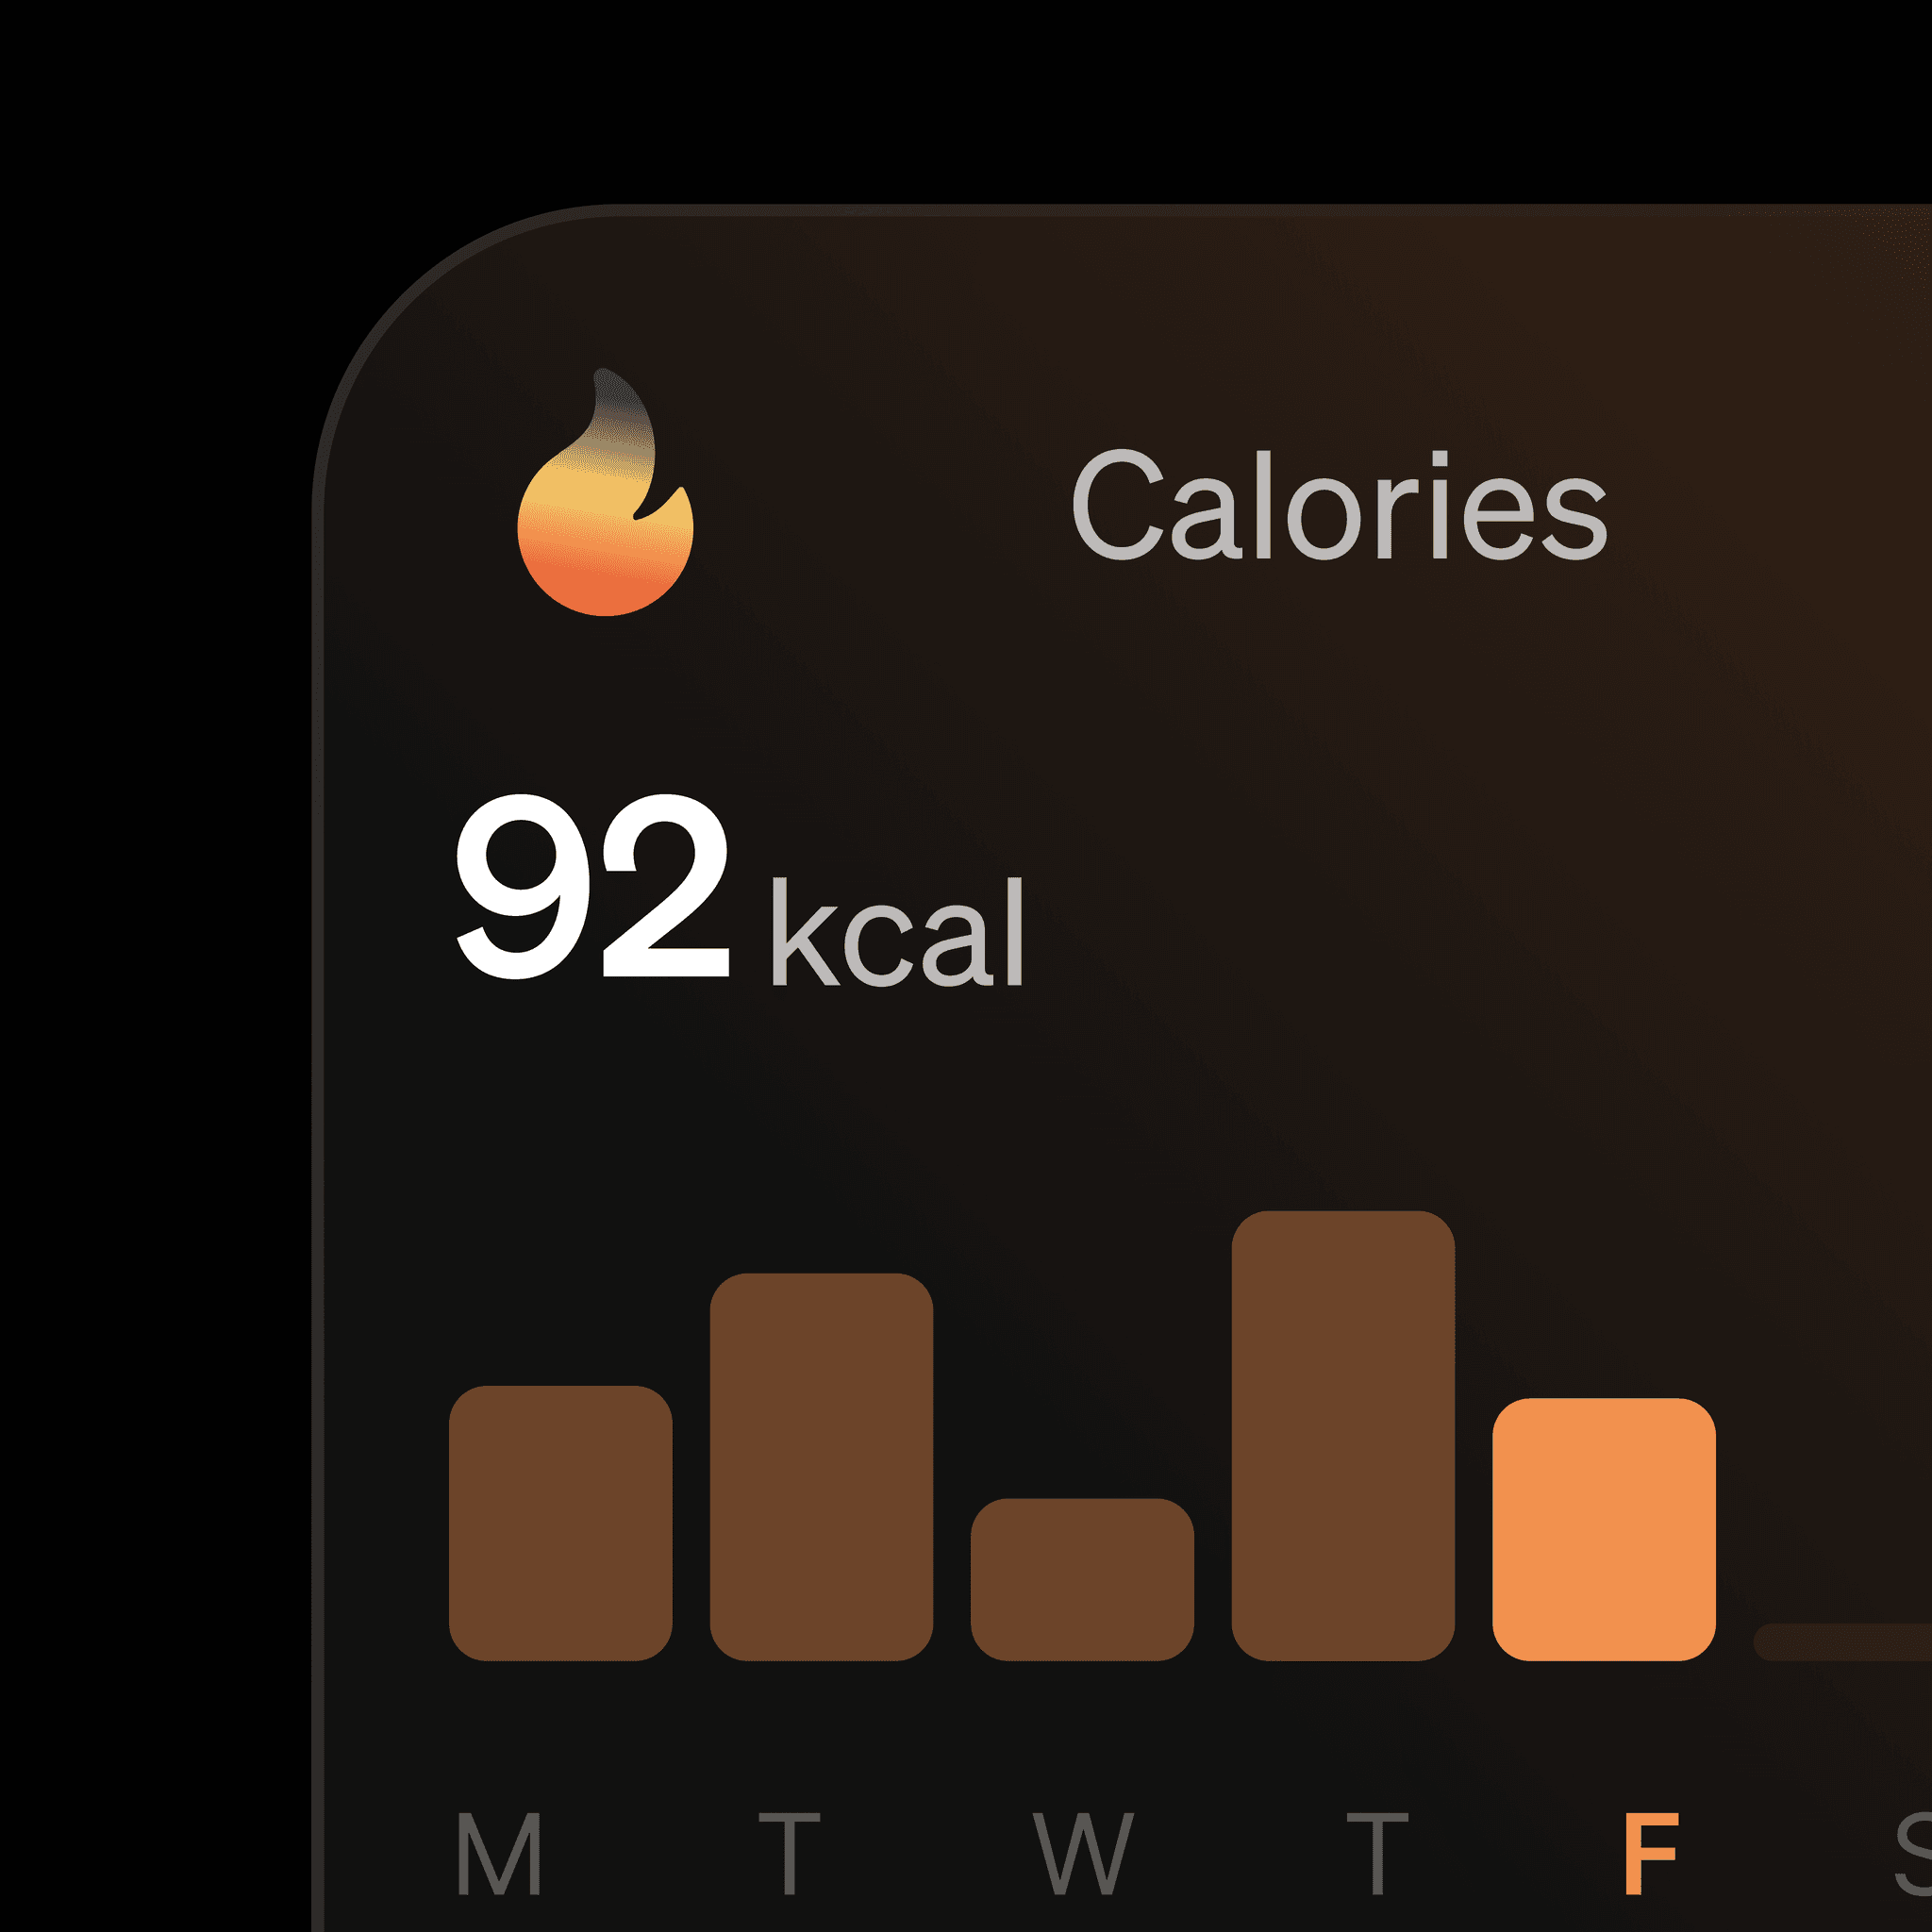
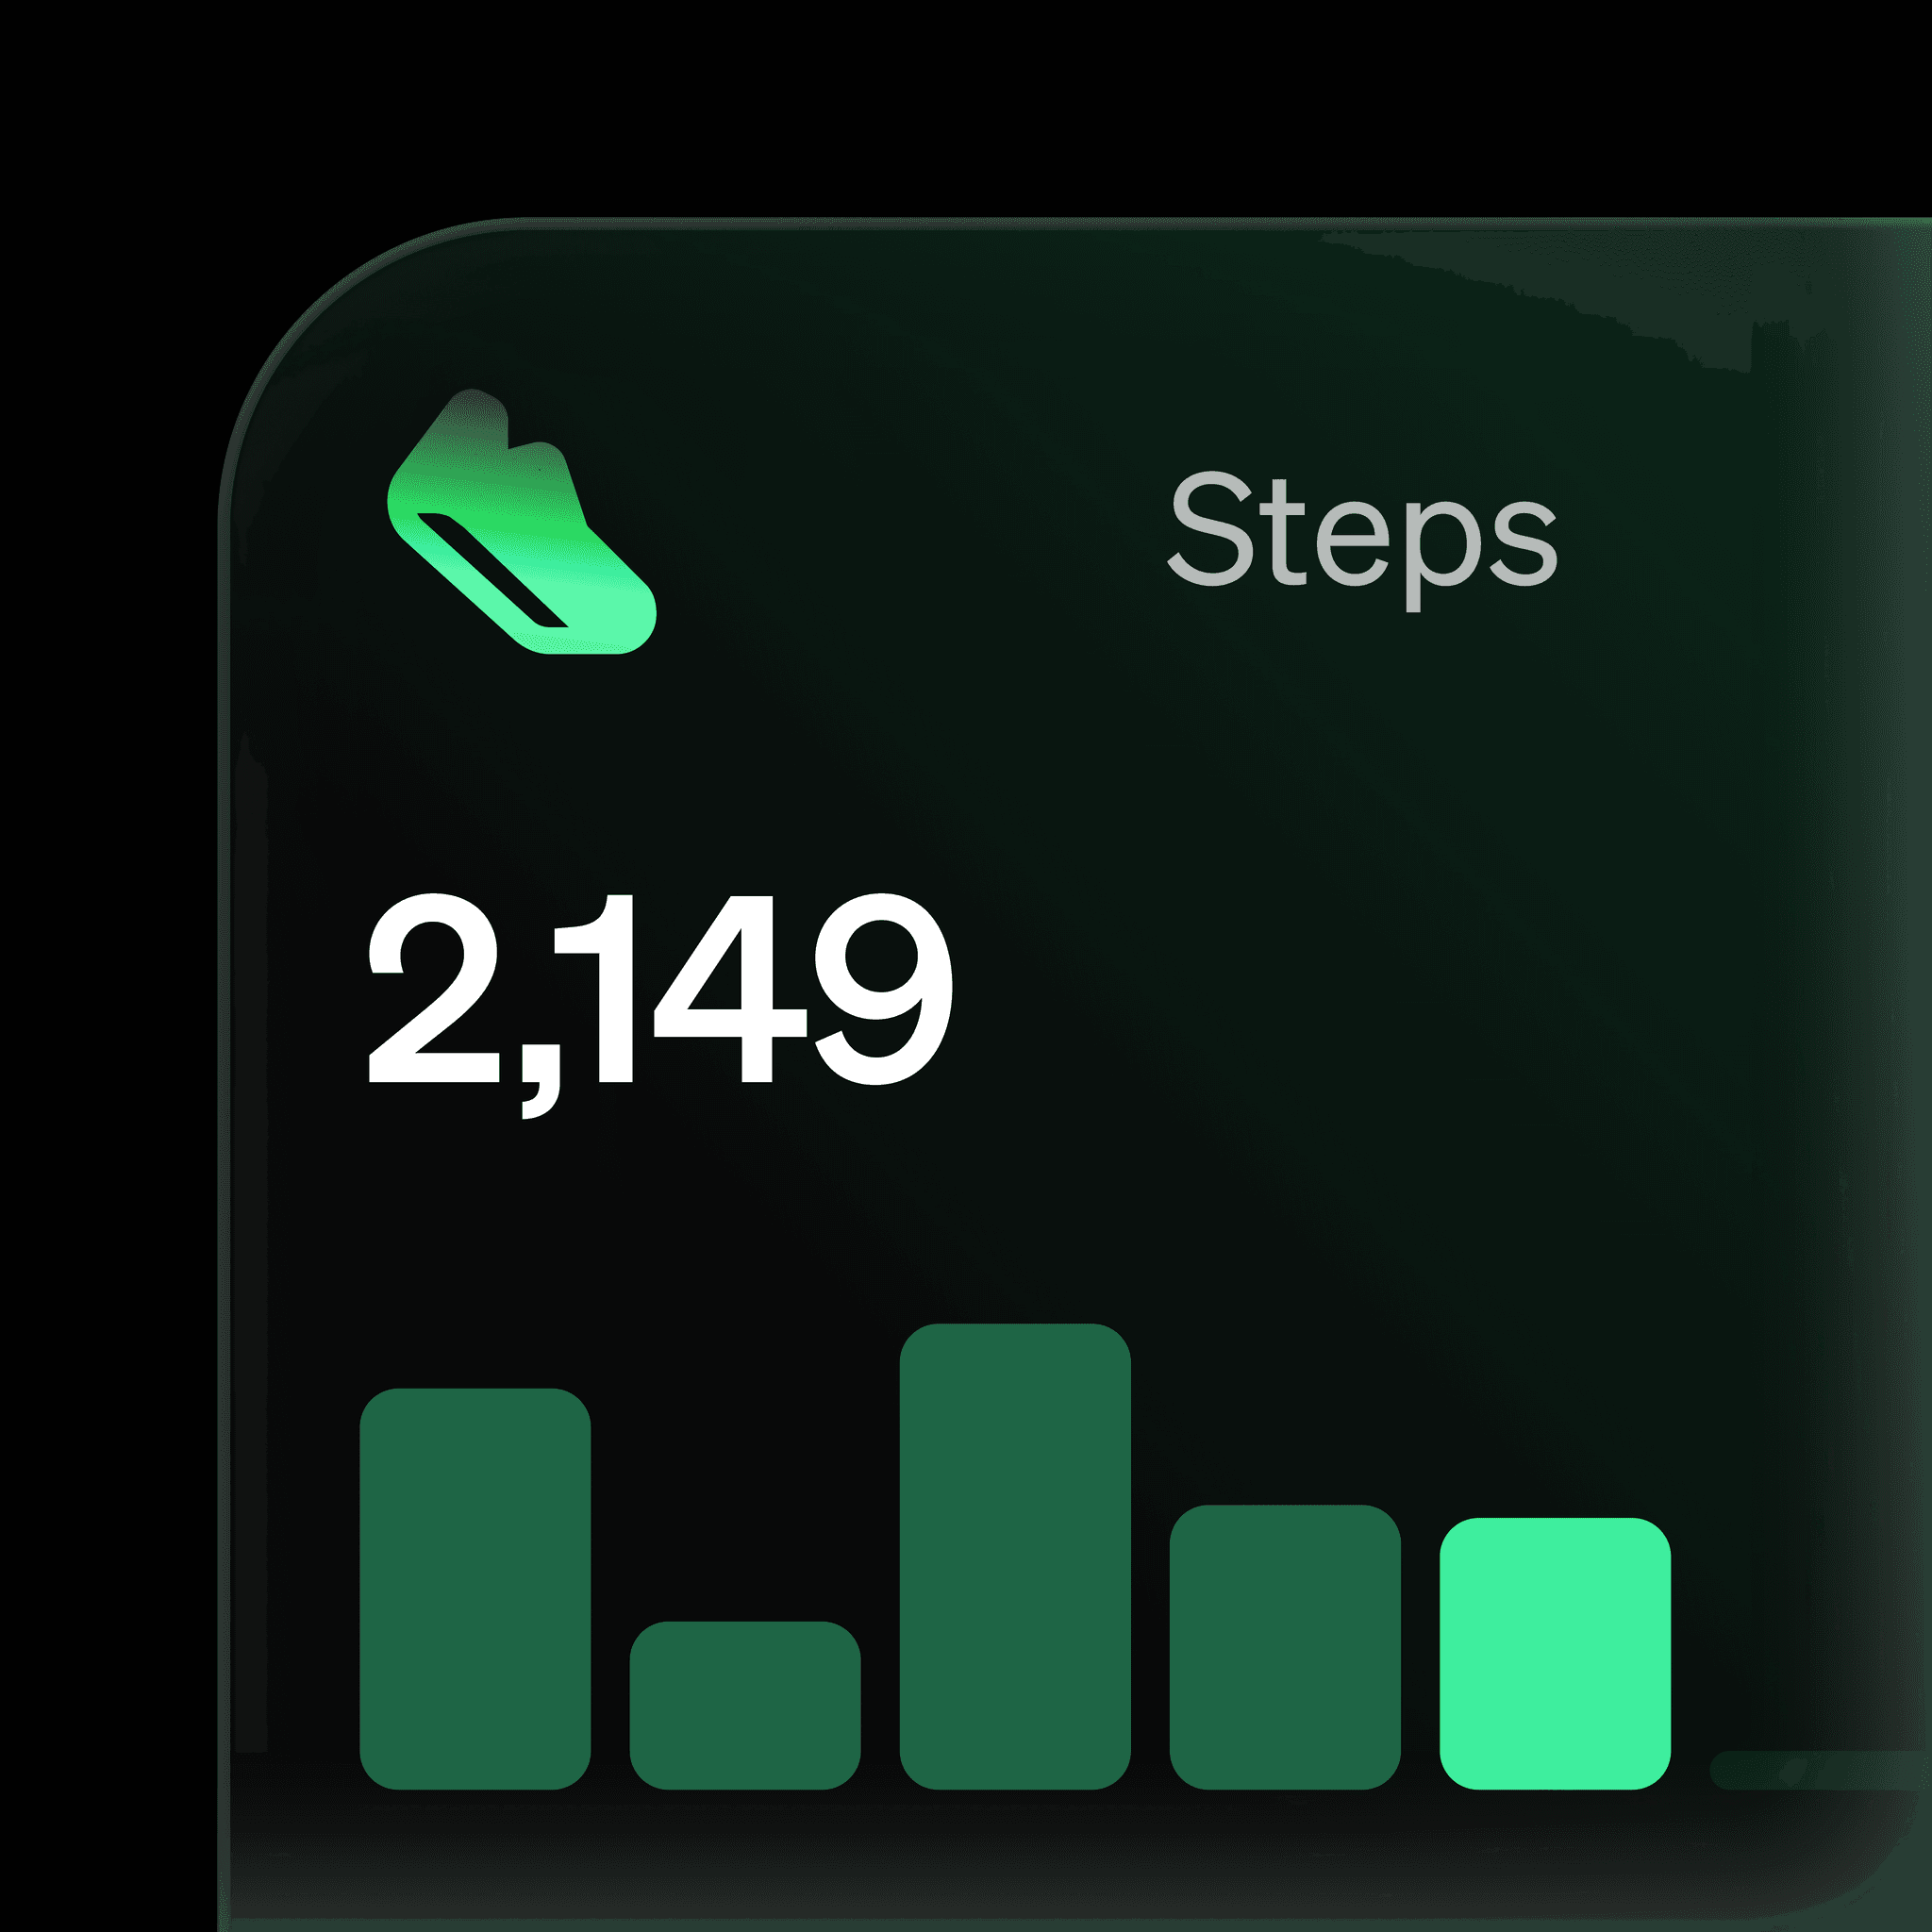
The redesigned Activity view gives users an immediate snapshot of their recent performance.
Key metrics such as:
- Workout duration
- Calories burned
- Distance
- Steps
are presented as visual cards, making the information easier to scan and compare.
The addition of 7-day performance data and highlights also gives users more context instead of showing isolated numbers.
2. Health and body metrics
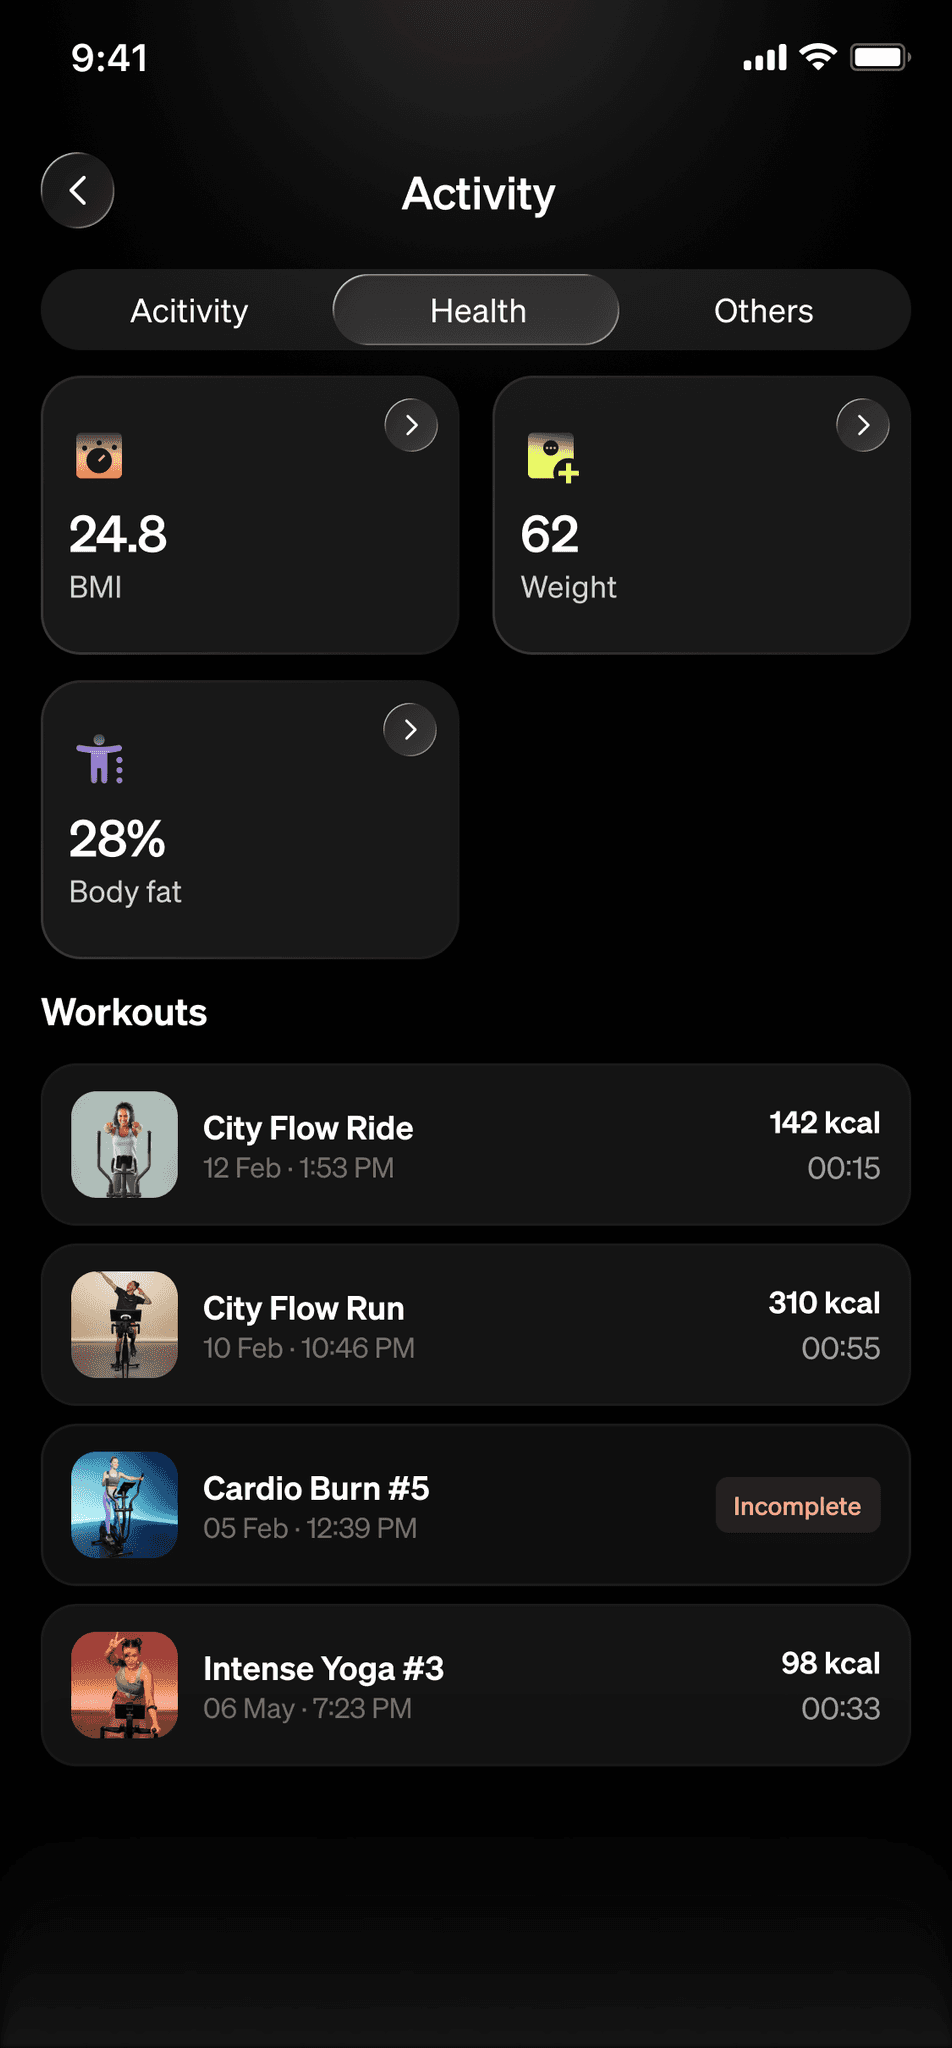
Health-related information was separated from activity data to create a clearer mental model.
The Health section brings together metrics such as:
- Heart rate
- Heart rate variability
- Resting heart rate
- ECG
- Sleep
This allows users to explore their overall wellbeing without mixing health metrics with workout performance.
Explorations
Design explorations
Tested different ways of prioritizing activity metrics, including:
- A single consolidated overview
- Metric-focused cards
- Larger hero metrics with supporting data
- More compact dashboard layouts